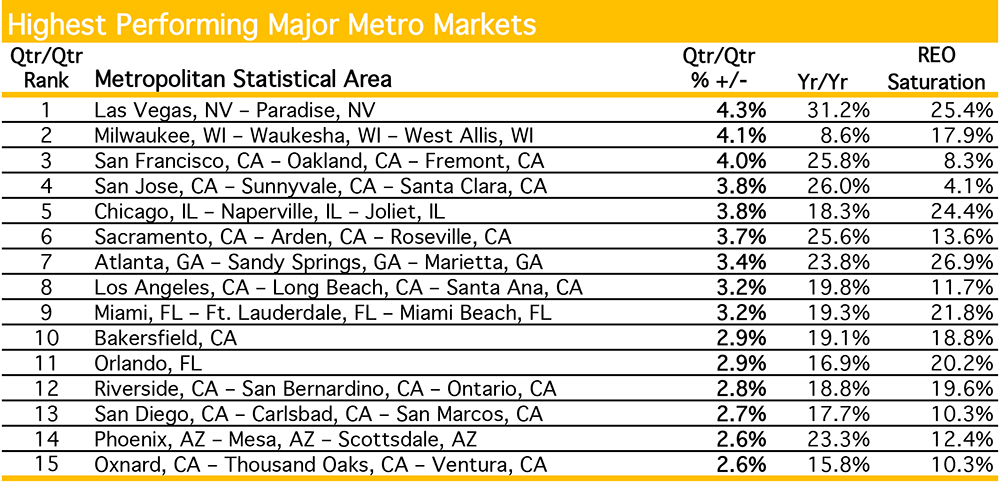
Representing a new post-bubble high, Las Vegas experienced a 31.2% jump in annual home prices in July, becoming the first metro to surpass 30% growth since the beginning of the recovery.
In the latest home data index released by Clear Capital, July home price trends continued to be strong both nationwide and when broken down between the nation's four major regions.
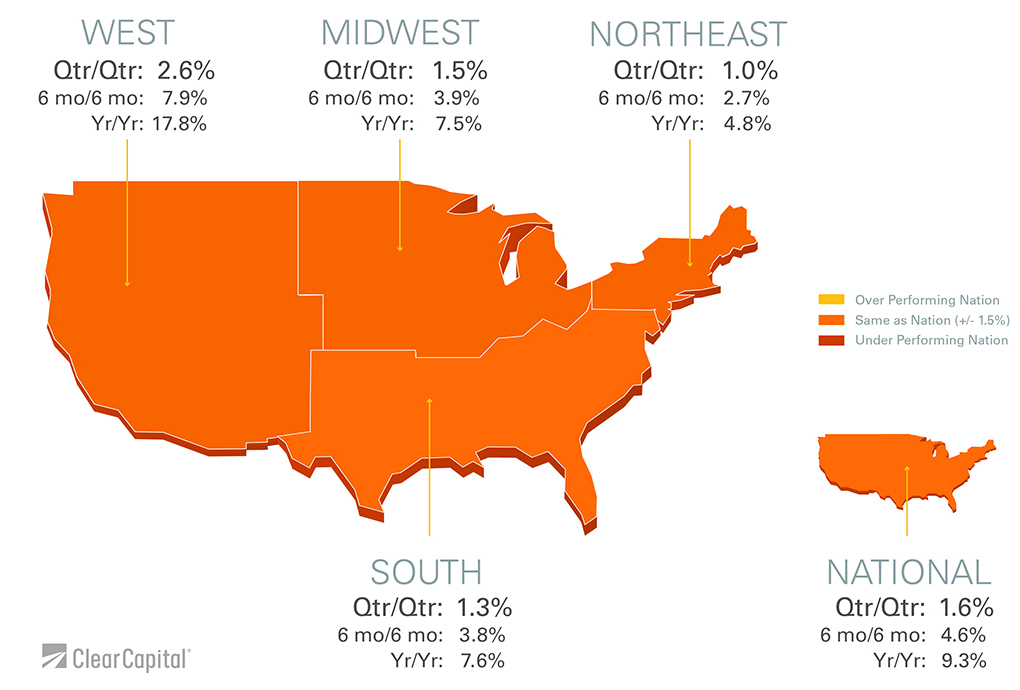
Nationally, home prices grew 9.3% from last year, and were up 1.6% over the previous quarter. Interestingly enough, national home prices remained 33.4% below peak values, indicating the new norm for the nation’s housing.
“While July home prices continue to ramp up throughout the country led by Las Vegas posting more than 30% yearly growth, let’s not forget a healthy recovery means moderation as the new normal takes hold,“ said Alex Villacorta, vice president of research and analytics at Clear Capital.
Over the last half of 2013, Clear Capital continues to call for a moderation in home price trends. “A rising price floor will dampen some potential homebuyers’ appetites, particularly as recent gains bring many markets back into pre-bubble equilibrium,” Villacorta added.
Homebuyers are beginning to adjust to the new normal, where steep discounts from the peak are not as attractive as they once were. According to Villacorta, if housing inventory continues rising, it should help alleviate some of the recent pressure on prices, as well as homebuyers’ confidence in the market’s health overall.
On a regional basis, the West led yearly gains, up 17.8% year-over-year in July. The Northeast recorded with a 4.8% increase, while the Midwest and the South posted annual gains of 7.5% and 7.6%, respectively.
The average growth rate for the top 15 performing metro markets reached 20.0%, while 14 metros posted yearly gains above 15%.
With its 31.2% growth, Las Vegas led the rebound. With a quarterly gain of 4.3% — the strongest of all the metros — indicated this metro could retain its No. 1 position at least for the near future.
While Las Vegas leads the recovery, it’s crucial to note that the Sin City’s median price of $145,000 ranks it below 35 of the top 50 markets. It seems, in fact, that the low price points may be driving Las Vegas’ gains.
On the other hand, San Jose reported gains of 26% over the year, despite its high median price of $710,000, indicating that demand if fueled by a strong local economy.
These two marks — Las Vegas and San Jose — will likely see a variance in their trends moving forward.
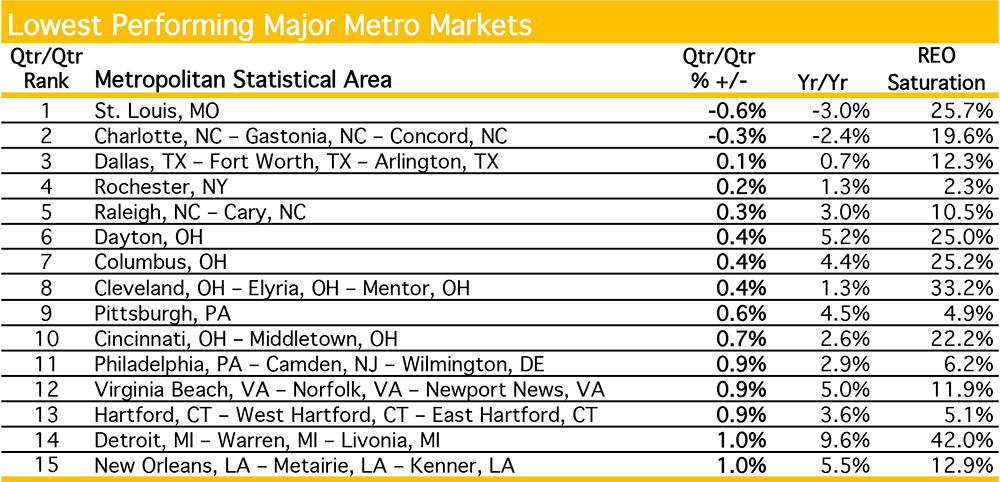
Among the lowest performing metros, only two out of the 15 posted quarterly losses, with prices dropping less than 1% for each. The rest of the group reported average yearly gains of 3%, proof that the more active spring and summer buying season have helped rebound most major markets’ home prices.
Over the last year, Detroit home prices have increased by 9.6% and, while the metro remains on the lowest performing list, its quarterly gains of 1% are the top among the group. Against the backdrop of an REO saturation rate of 42% — more than 27percentage points above the national average — these gains are particularly impressive.
“After these shifting fundamental drivers shake out, we expect the recovery to continue at a healthier and more sustainable pace,” said Villacorta.
“Big picture, though, the housing market overall is in a great position and likely to continue to improve. All the more reason we must continue to observe performance market by market,” he added.


