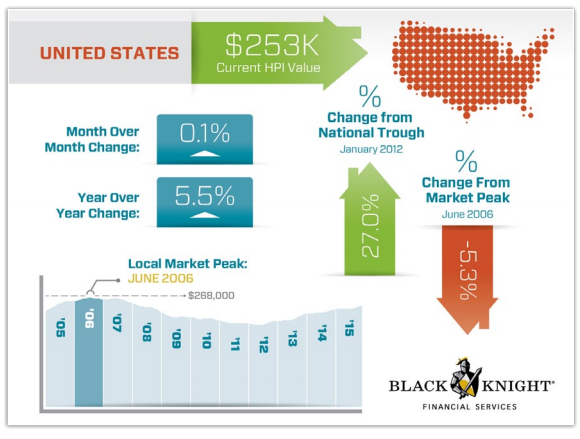
Once again, home prices are trending higher, rising 0.1% from October, and 5.5% on a year-over- year basis, the November Black Knight home price report found.
As a result, national home prices are up 27% since the bottom of the market at the start of 2012 and are just 5.3% off the June 2006 peak.
Click to enlarge
(Source: Black Knight)
The Black Knight HPI utilizes repeat sales data from the nation’s largest public records data set, as well as its “market-leading, loan-level mortgage performance data, to produce one of the most complete and accurate measures of home prices available for both disclosure and non-disclosure states.”
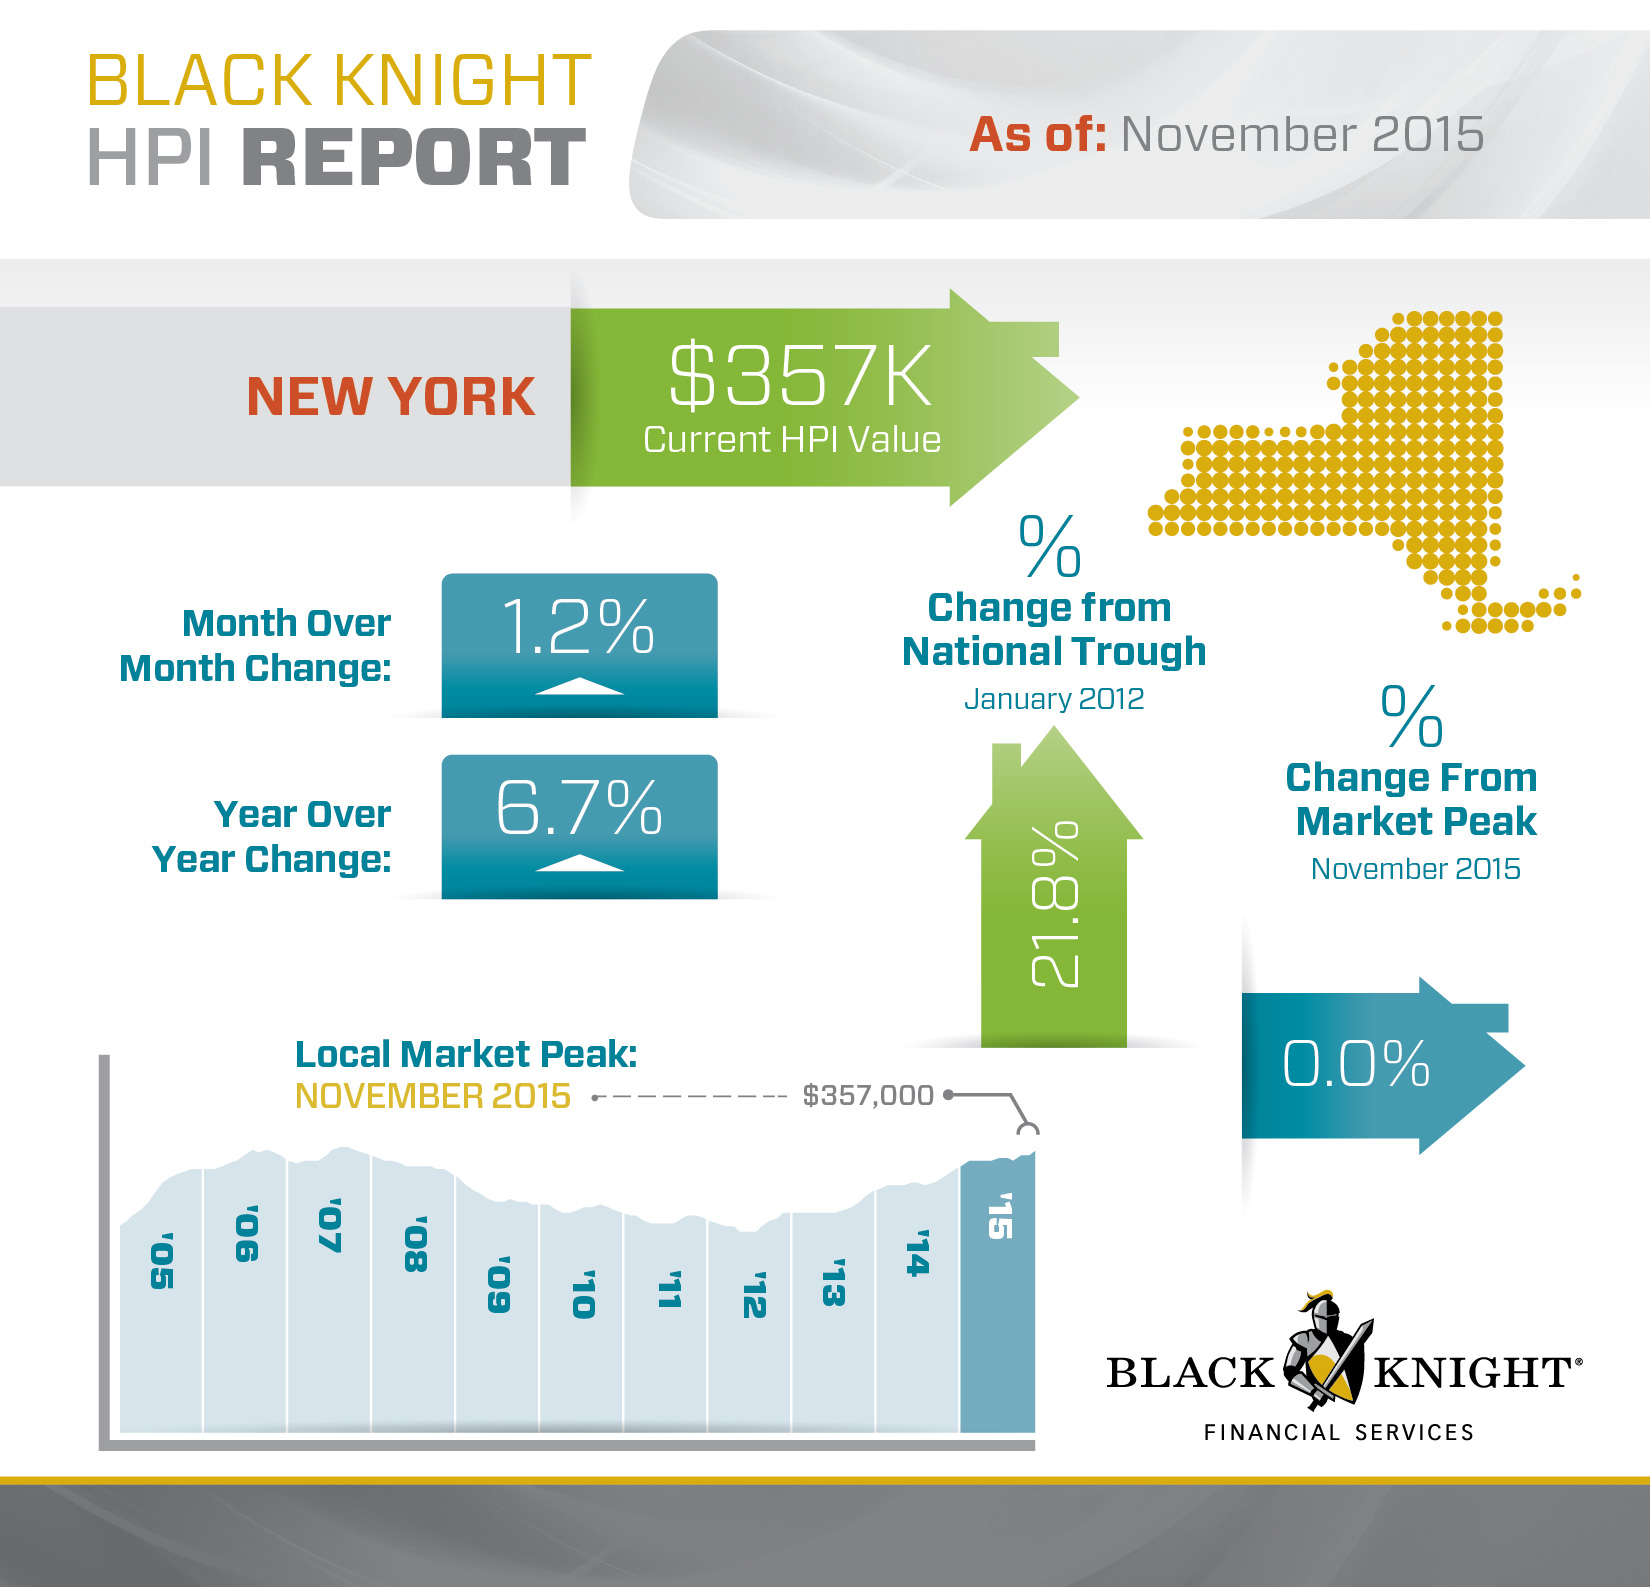
Notably, New York led gains among the states for the fifth straight month, seeing 1.2% month-over-month appreciation, the report said.
The state accounted for five of the top 10 best performing in November, with NYC leading at 1% month-over-month growth.
Here’s a breakdown of just New York.
Click to enlarge
(Source: Black Knight)
Along with New York, Tennessee and Texas also hit new peaks in November:
- New York ($357K)
- Tennessee ($179K)
- Texas ($216K)
And at the metro level, of the nation’s 40 largest metros, seven hit new peaks:
- Austin, Texas ($286K)
- Dallas, Texas ($221K)
- Denver, Colorado ($329K)
- Houston, Texas ($220K)
- Nashville, Tennessee ($222K)
- Portland, Oregon ($324K)
- San Antonio, Texas ($195K)


