The number of homes flipped in 2015 was the highest in nearly 10 years, according to a report from RealtyTrac. The report showed that 179,778 single-family homes and condos were flipped — the highest since 2007.
According to RealtyTrac’s fourth-quarter 2015 U.S. Home Flipping Report, flips made up 5.5% of all single-family home and condo sales, up from a 5.3% share in 2014. This is the first annual increase in share of homes flipped following four years of shrinking.
“As confidence in the housing recovery spreads, more real estate investors and would-be real estate investors are hopping on the home-flipping bandwagon,” said Daren Blomquist, senior vice president at RealtyTrac.
“Not only is the share of home flips on the rise again, but we also see the flipping trend trickling down to smaller investors who are completing fewer flips per year. The total number of investors who completed at least one flip in 2015 was at the highest level since 2007, and the number of flips per investor was at the lowest level since 2008,” added Blomquist.
A flip is defined as a home that is bought and sold again within the same 12 months. In 2015, the 5.5% share of U.S. homes flipped in 2015 was still well below the peak of 8.2% of U.S. homes flipped in 2005.
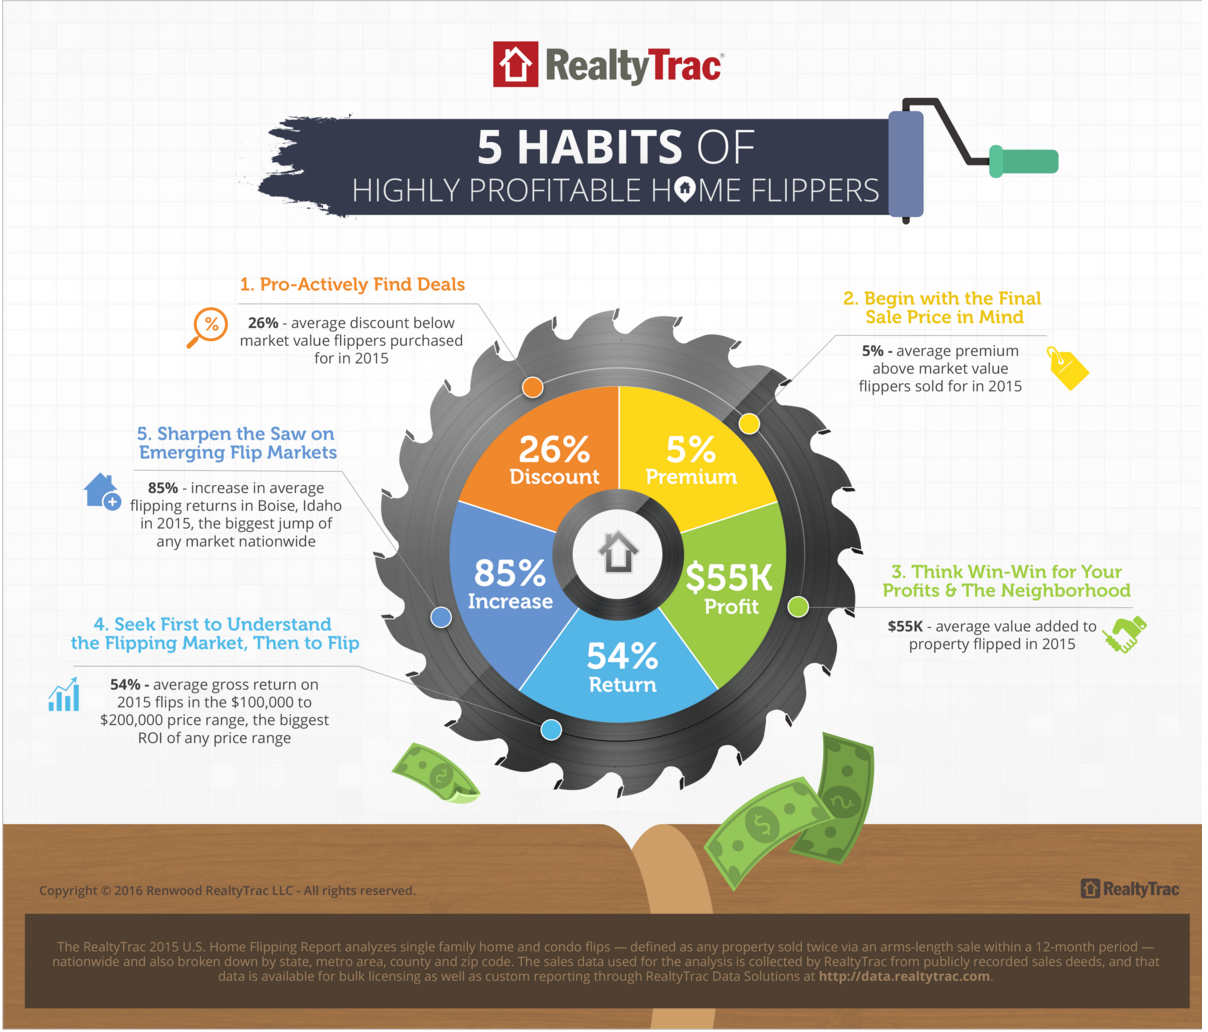
See below for the five habits of highly profitable home flippers. Click to enlarge.
The share of homes flipped in 2015 was above 2005 levels in 12 of the 110 metro areas, including Pittsburgh, Memphis, Buffalo, New York, San Diego, Seattle, Birmingham, Alabama, and Cleveland.
“When home flipping numbers go up, it is usually an indication that the housing market is in trouble,” said Matthew Gardner, chief economist at Windermere Real Estate, covering the Seattle market, where the share of homes flipped in 2015 was down from 2014 despite being above 2005 levels.
“The problem with a rise in home flipping is that these sales artificially inflate home prices, making housing even less affordable for buyers and increasing the risk of a bubble. I’m happy to see that the percentage of home flipping sales in Seattle does not exceed the national average and that they’re down from a year ago. This makes sense given our affordability constraints and lower potential for profits for home flippers,” added Gardner.
Metro areas with the biggest year-over-year increase in share of flips were Lakeland, Florida, New Haven, Connecticut, Jacksonville, Florida, Homosassa Springs, Florida, and Akron, Ohio.
“We continue to see distressed properties funnel through the pipeline in South Florida, which makes it ripe for investors to profit in a strong selling market,” said Mike Pappas, CEO and president at the Keyes Company, covering the South Florida market.
“There are always sellers that will discount for a quick cash sale and open the door for astute investors to make a good return by repositioning the property,” Pappas said.
The Miami metro area had the most homes flipped of any market nationwide in 2015, with 10,658, representing 8.6% of all Miami-area home sales for the year and up 4% as a share of all sales from 2014.
Among 110 metro areas with at least 250 flips in 2015, those with the highest average gross flipping profit in dollars in were San Francisco, San Jose, California, New York, Los Angeles, and Oxnard-Thousand Oaks-Ventura, California.
States with the highest share of home flips in 2015 were Nevada, Florida, Alabama, Arizona and Tennessee.
Among states with at least 1,000 single family homes flipped in 2015, those with the biggest year-over-year increase in share of flips were Connecticut, Oregon, Maryland, Illinois, and New Jersey.
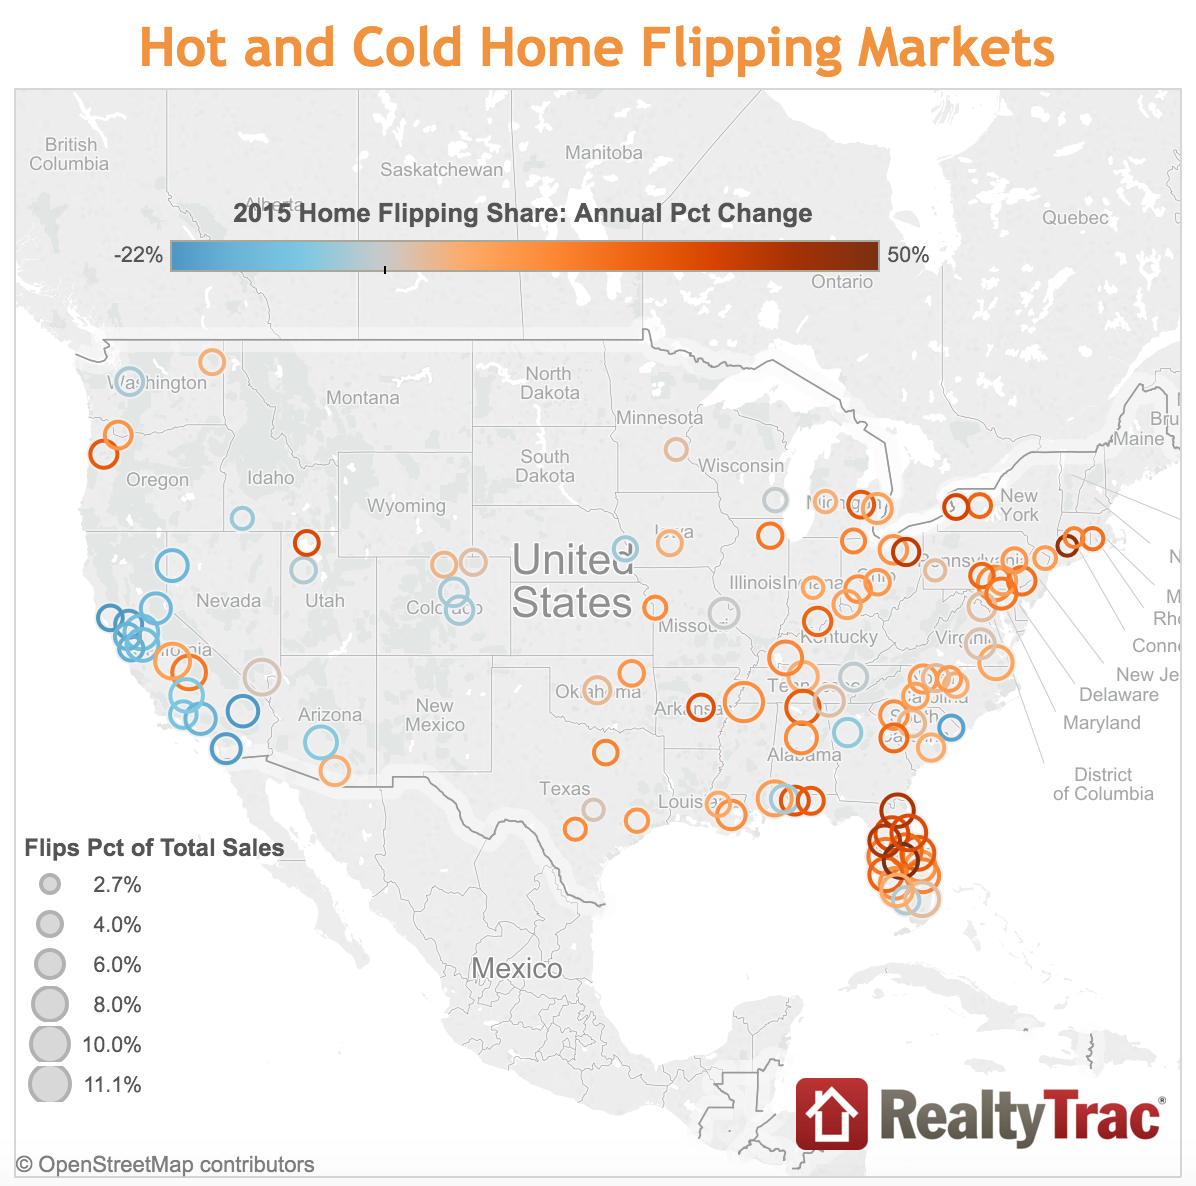
See below for the rest of the 2015 hot and cold home flipping markets. Click to enlarge.


