Home prices continued to steadily increase in October, and the higher prices go, the more unaffordable the housing market becomes.
According to the latest data released Tuesday by S&P Dow Jones Indices and CoreLogic, the S&P CoreLogic Case-Shiller U.S. National Home Price NSA Index, which covers all nine U.S. census divisions, posted a 5.6% annual gain in October, up from 5.4% last month.
The 10-City Composite recorded a 4.3% annual increase, up from 4.2% the previous month, while the 20-City Composite reported a year-over-year gain of 5.1%, up from 5.0% in September.
Last month’s report showed that home prices finally surpassed all-time highs set in July 2006, with prices recording a 5.5% annual gain in September.
On a monthly basis, after seasonal adjustment, the National Index recorded a 0.9% month-over-month increase, while both the 10-City and 20-City Composites each reported a 0.6% month-over-month increase.
“Home prices and the economy are both enjoying robust numbers,” says David Blitzer, managing director and chairman of the Index Committee at S&P Dow Jones Indices. “However, mortgage interest rates rose in November and are expected to rise further as home prices continue to out-pace gains in wages and personal income.”
The most recent mortgage rate report from Freddie Mac posted that mortgage rates jumped to a two-year high, with the 30-year fixed-rate coming in at 4.3% for the week ending Dec. 22, 2016.
“Affordability measures based on median incomes, home prices and mortgage rates show declines of 20-30% since home prices bottomed in 2012,” he continued. “With the current high consumer confidence numbers and low unemployment rate, affordability trends do not suggest an immediate reversal in home price trends.”
He noted that home prices cannot rise faster than incomes and inflation indefinitely.
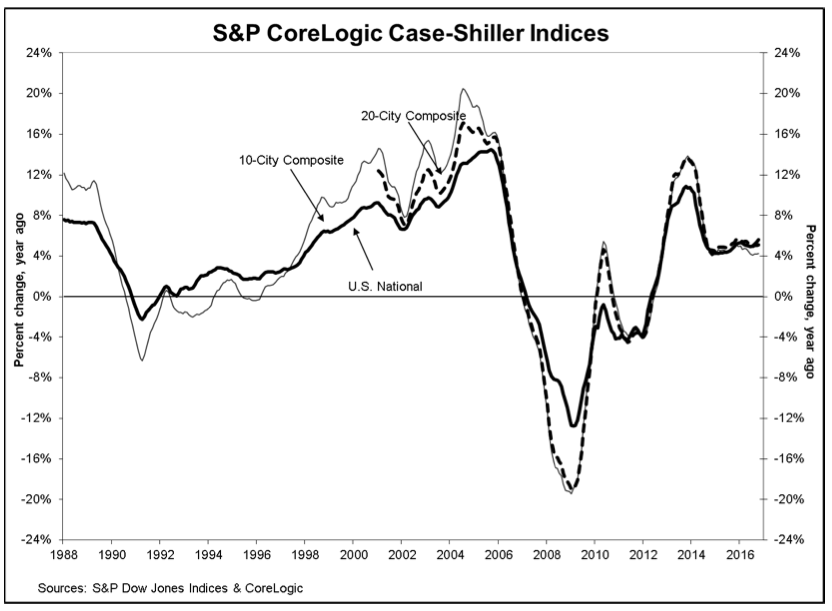
The chart below show the annual returns of the U.S. National, the 10 -City Composite, and the 20- City Composite Home Price Indices.
Click to enlarge
(Source: S&P Dow Jones Indices and CoreLogic)
Blitzer noted that after the S&P CoreLogic Case-Shiller National Index bottomed out in February 2012, its year -over-year growth accelerated to a peak rate of 10.9% in October 2013 and then gradually fell to its current rate of approximately 5%.


