Some of America’s top suburban hotspots are becoming more popular amid rising home prices, according to a new study from realtor.com.
As home buyers increasingly look outside urban areas, home prices, home sales and more competition continues to rise in the suburbs.
“Suburbs are traditionally viewed as meccas for young families, willing to trade in shorter commute times and urban nightlife for better schools and larger homes,” realtor.com Chief Economist Jonathan Smoke said. “But the relationship between the suburbs and urban areas is far more intertwined.”
“In recent years, rising home prices and inventory shortages in urban centers have made affordable suburban home prices more appealing for buyers,” Smoke said. “Our analysis indicates 50% of buyers planning to purchase a home this spring indicated they preferred a home in the suburbs.”
And while the commute will be longer for these homebuyers in the suburbs, the good news is economists expect gas prices to remain low over the next two years, creating less of a strain on their budget.
“OPEC is unlikely to sustain the production cuts which it implemented in January, but we expect a combination of rising global demand and increased US shale production to keep prices fairly stable for the next year or two,” said Andrew Kenningham, Capital Economics chief global economist. “For the world as a whole, this would probably be the ideal outcome.”
Realtor.com, an online homebuyer-focused real-estate listing service, created a list of the top suburbs in the nation’s 50 largest metropolitan areas. These suburbs were then ranked based on a score measuring household growth, listing price growth and housing supply and demand.
10. Friendship/Apex, North Carolina
Metro: Raleigh, North Carolina
This number of households in the suburb grew 25.2% from 2010 and 2017. A typical property in the suburb spent 34 days on the market, 25 days less than average in the study. Listing prices grew by 14% annually over the past three years.
9. Williamsburg/Waterhill/White Haven/Blackman, Tennessee
Metro: Nashville-Davidson-Murfreesboro-Franklin, Tennessee
This number of households in the suburb grew 16.3% from 2010 and 2017. A typical property in the suburb spent 34 days on the market, 25 days less than average in the study. Listing prices grew by 14% annually over the past three years.
8. Milpitas, California
Metro: San Jose-Sunnyvale-Santa Clara, California
This number of households in the suburb grew 15.5% from 2010 and 2017. A typical property in the suburb spent 23 days on the market, 36 days less than average in the study. Listing prices grew by 12.8% annually over the past three years.
7. Cutler Bay/Lakes by the Bay, Florida
Metro: Miami-Fort Lauderdale-West Palm Beach, Florida
This number of households in the suburb grew 12.3% from 2010 and 2017. A typical property in the suburb spent 50 days on the market, nine days less than average in the study. Listing prices grew by 16.3% annually over the past three years.
6. Vista East/Vista Park, Florida
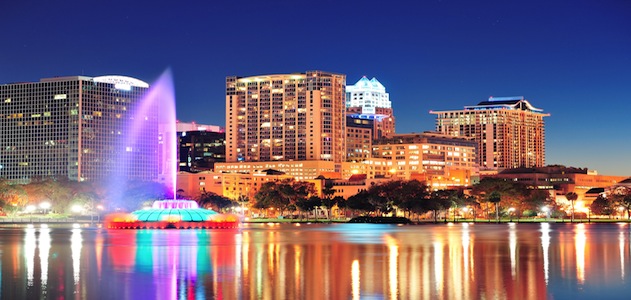
Metro: Orlando-Kissimmee-Sanford, Florida
The suburb attracts those with an active lifestyle with its hiking trails, lakes and short commute to the ocean. It is also just 30 minutes from Disney World and Universal. Listing prices grew by 13.8% annually over the past three years.
5. Orient Park/Progress Village/Palm River-Clair Mel, Florida
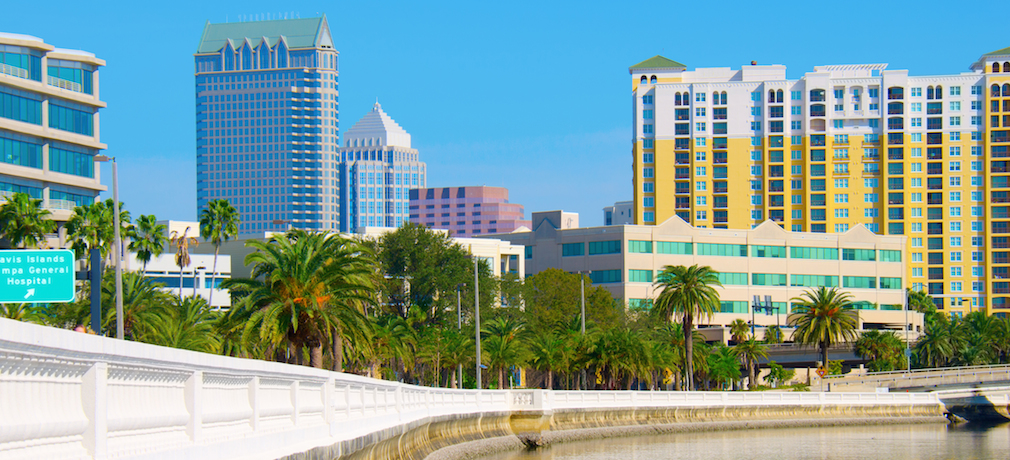
Metro: Tampa-St. Petersburg-Clearwater, Florida
The suburb attracts many first-time buyers due to its affordable housing options. A typical property in the suburb spent 47 days on the market, 12 days less than average in the study. Listing prices grew by 19.8% annually over the past three years.
4. Daffan/Hornsby Bend, Texas
Metro: Austin-Round Rock, Texas
A typical property in the suburb spent 45 days on the market, 14 days less than average in the study. Listing prices grew by 27.1% annually over the past three years, making it the second highest suburb for home price growth.
3. Dublin/Dougherty, California
Metro: San Francisco-Oakland-Hayward, California
This number of households in the suburb grew 25.6% from 2010 and 2017. A typical property in the suburb spent 24 days on the market, 35 days less than average in the study, and listings received 2.1 times more views than the average home in the study.
2. Wylie/St. Paul, Texas
Metro: Dallas-Fort Worth-Arlington
This number of households in the suburb grew 12.3% from 2010 and 2017. A typical property in the suburb spent 41 days on the market, 18 days less than average in the study. Listing prices grew by 18.7% annually over the past three years, and listings recieved 2.4 times more views than the average home in the study.
1. Northeast/Montebello, Colorado
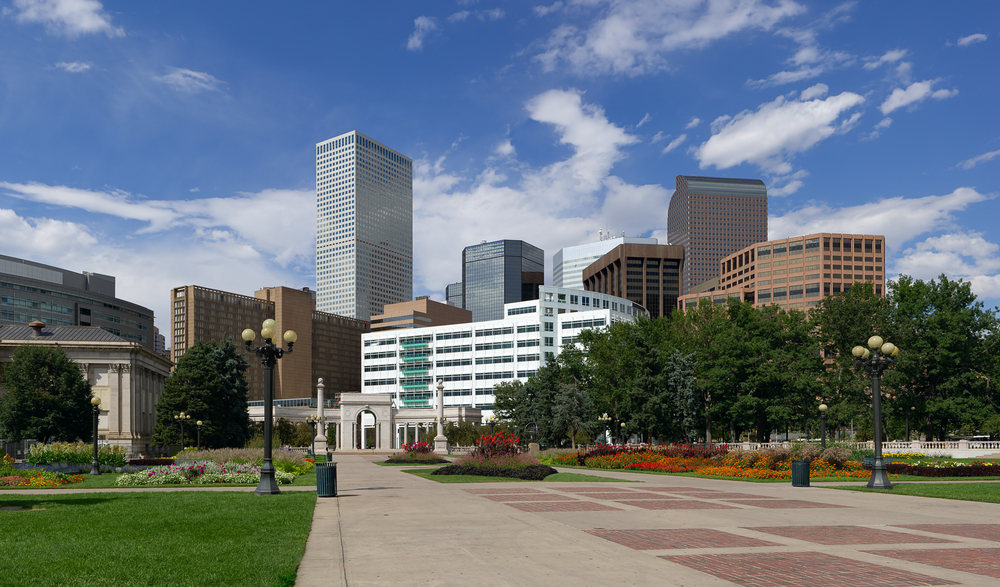
Metro: Denver-Aurora-Lakewood, Colorado
A typical property in the suburb spent 19 days on the market, 40 days less than average in the study. Listing prices grew by 20.6% annually over the past three years, and listings received 1.7 times more views on realtor.com than other homes in the study.


