Modern analysis of real estimate markets is a great example of the new world of “big data”.
Some of the empirical analysis of housing markets thirty plus years ago relied upon national and annual indexes of the price of housing.
Today it is possible to have information about millions of properties at much more frequent intervals.
Living in the world of big data presents both new opportunities to understand housing markets better but also challenges to some ways of thinking built upon the conventional wisdom of the past.
For example, our firm generates updated AVM estimates for over 90 million properties each month and provides insights and tools to assign values to properties underlying residential mortgages. On the other hand, such geographically granular analysis of property values provides a strong challenge to the notion of a national housing market and the insights provided by national house price indexes.
The purpose of this article is to use some of the geographically granular data available at Collateral Analytics to exemplify what is possible in today’s world and to help debunk the notion of a national housing market.
We focus upon comparisons of zip code level housing prices indexes developed by us to the national index of house prices produced by the Federal Housing Finance Agency.
The time period covered is January 2005 through December 2013. Zip codes with a 2010 Population of at least 10,000 and with monthly data for each month during this period are the subject of analysis. This produces information for about 5,500 zip codes from a wide variety of places around the country. The zip code indexes represent the sale price per square foot and the national index is FHFA’s purchase only index.
The percentage differences between the national index and the Collateral Analytics zip code indexes are computed each month (HPDIFF = (US Index base 2005:1 less Zip Code Index base 2005:1)/Zip Code Index).
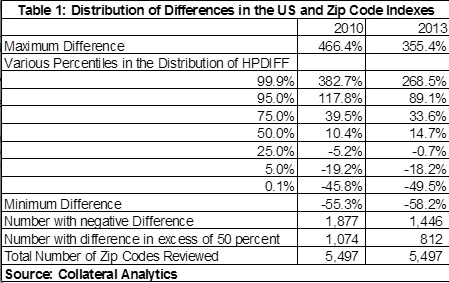
Summary measures of the distribution of these differences are presented in Table 1 for the changes between 2005 and 2010 and between 2005 and 2013. For example, the median values of the gap are 10.4% in 2010 and 14.7% in 2013. That is, the US Index grew 10.4% faster than the median zip code indexes in 2010 and 14.7% more rapidly than the zip code level indexes in 2013, respectively. Prices at the zip code level grew more rapidly than the US Index in only 1,877 and 1,446 of the zip code 5,497 zip codes in 2010 and 2013, respectively.
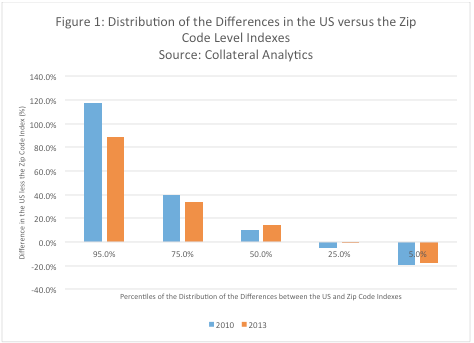
Figure 1 (click to enlarge) also seeks to highlight the wide distribution of these differences around the national index.
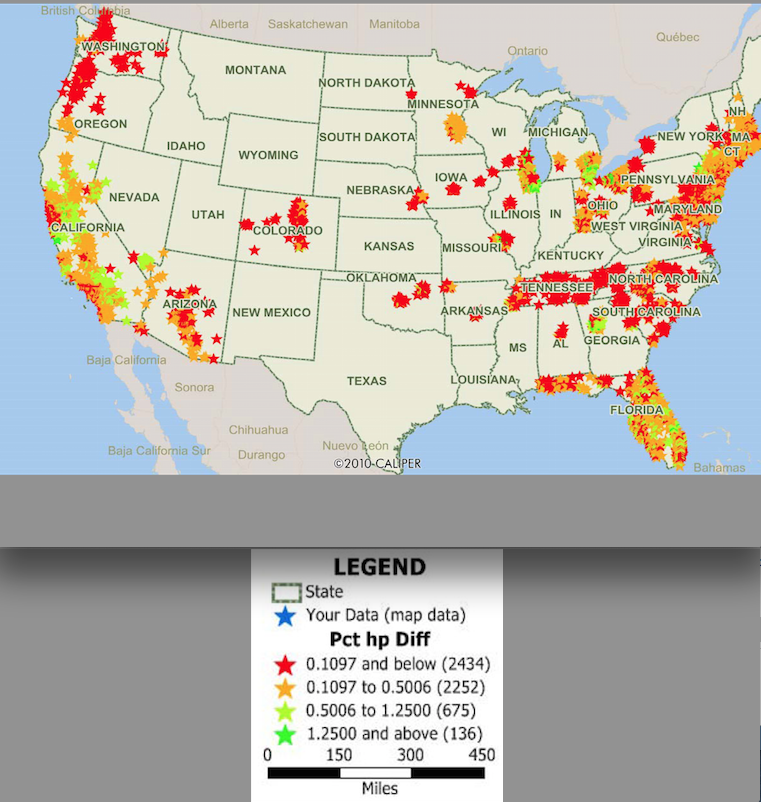
Figure 2 maps these differences for the changes between 2005 and 2013.
The zip codes with negative values are those in red. The brighter the shade of green the greater is the difference between the US and zip code level index.
Most of the zip codes with positive differences are in the coastal states, but most states include both positive and negative differences.
For example, 185 of the 930 zip codes in California have negative values – price growth at the zip code exceeded growth in the US Index; however, most zip codes in California are lagging the growth in the national average and some by substantial amounts. On average, the US index exceeds the zip code level indexes by 25% among these zip codes in 2013. (click to enlarge)
As noted in the introduction, the opportunity to study the wide variation in house price trends at the zip code level is an outgrowth of the enormous amounts and quality of data available to the modern analyst.
Indeed, we could go even more geographically granular levels below the zip code.
These rich data strongly suggest that house price variations at the local level vary widely among local markets. Alternatively stated, these results and many others like them strongly reject the notion of a national housing market.
This conclusion raises issues for some participants in the housing market and current best practices.
One that we have in mind is the relative stability of residential mortgage interest rates among local housing markets.
The residential mortgage rate reflects the current level of long term interest rates and two components of the risk of such lending: interest rate and credit risk. As such, variations in the mortgage rate among markets should reflect variations in future house price movements. Recent data from Freddie Mac indicates that regional averages on 30-year fixed rate mortgage rates vary from 4.08 to 4.17%.
This and other evidence strongly suggest to us that such variation grossly underestimates the variation in the credit risk implicit in residential mortgages due to the wide variation in house prices among local markets. This is especially the case for mortgage with relatively high loan to value ratios and the credit risk associated with the potential of declining prices is most acute.
Such a concern has led us to develop a new credit risk model capable of generating estimates of the credit risk of residential mortgages that are more in tune with variations in house price expectations among markets and other local market conditions that affect credit risk.
Our estimates credit risk spread estimates rest upon our own projections of future house prices at the metropolitan area level for a variety of scenarios from the expected to a severe or stress scenario.
These clearly are not perfect and surely contain a variety of potential measurement and model errors. However, evidence of the type we offer in this article and in other work that we have done strongly rejects one alternative hypothesis – variations in house price expectations among local housing markets are insufficient to warrant much wider variations in mortgage rates among regions of the country.
In particular, our work suggests that rates should be higher in areas in which future price expectations are less optimistic and vice versa.


