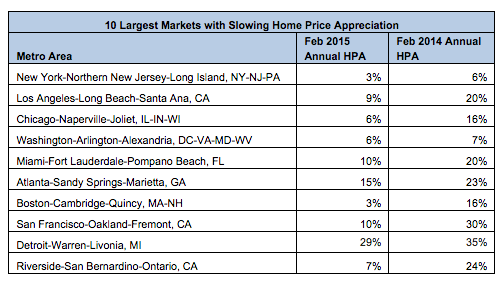
Home price appreciation slowed in February compared to annual home price appreciation a year ago in 60 of the 92 metros analyzed with a population of 500,000 or more, the latest RealtyTrac report said.
“While still significant at 33%, the average discount buyers are realizing on distressed homes has been shrinking over the past 18 months after hitting a high of 40% in September 2013,” said Daren Blomquist, vice president at RealtyTrac.
“Inventory of distressed properties is drying up in many markets even while demand for those properties — which typically fall into the target market for both investors and first-time homebuyers — is ramping up. That is in turn resulting in nationwide home prices skewing higher as a smaller share of homes sell at the lower end of the market.”
In addition, the median home price in February increased 14% from a year ago but was flat from the previous month to $183,000. The median sales price of distressed homes — those in the foreclosure process or bank-owned — increased 13% from a year ago to $127,000, 33% below the median sales price of non-distressed properties, $190,000.
Click to enlarge
Source: RealtyTrac
Broken up across the nation’s largest metros, home price appreciation slowed in 65% of metros.
Click to enlarge
Source: RealtyTrac
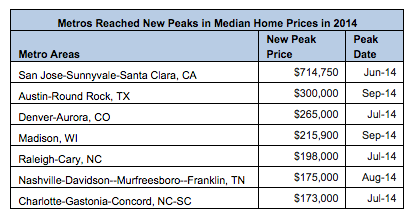
Meanwhile, 17 metro areas reached new peaks in median home prices in 2014.
Click to enlarge
Source: RealtyTrac


