The housing forecast for the second half of 2015 fails to show any positive data, with trends predicted to go downhill.
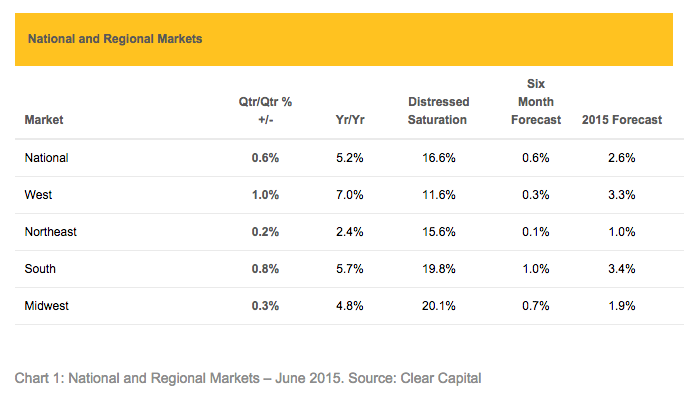
According to the latest market report from analytics firm Clear Capital, nationally, the data is more of the same. Data through June looks similar to data through May 2015, with no change in quarterly growth at 0.6% and a slight drop of 0.1% in yearly growth, from 5.3% to 5.2%.
What’s worse is that the best of the year is already past since the spring and summer seasons typically reflect the peak of the housing demand cycle. And 0.6% quarterly growth is a foreboding sign of how the remainder of 2015 may play out, the report explained.
“With a first full look of the spring buying season and six-month update to the forecast, our data through June confirms our initial projection that 2015 would be a non-growth year,” said Alex Villacorta, vice president of research and analytics at Clear Capital.
“In January 2015, we forecasted total 2015 national growth would come in at 1.3%, more than five percentage points from where we ended 2014 at 6.7% national growth. Here we are six months later, and there is very little evidence to change our view that the year will end up with price growth coming in just around the rate of inflation. Our adjusted forecast calls for year-end national growth of 2.6%, falling within our initial projected range of between 1% to 3%,” Villacorta continued.
The numbers don’t look too much better at the regional level, with growth across all regions remaining flat.
Click to enlarge
(Source: Clear Capital)
In terms of price growth, the West continues to be strongest at 1% quarterly growth, while the Midwest saw an increase in quarterly growth, from 0.1% to 0.3%.
“Along with this flattening across all four regions, distressed saturation fell, as is seasonally expected during the busy buying seasons,” the report said.
The report also gave an update on the tough housing situation going on in San Francisco and San Jose.
The report noted that while San Francisco’s and San Jose’s year-end growth rates are projected to remain positive, at 3.4% and 3.2%, growth for both regions through the second half of 2015 is forecasted to fall into negative territory, at -0.2% and -0.4%.
Why could this become a bigger issue? Well, the bad news comes after the summer buying season and two years of consecutive, yet unsustainable, gains.
“In our June report, we went on record with concern of bubble markets across the U.S. Now San Jose is starting to go the way of San Francisco, at peak levels and now leveling off. Both San Francisco and San Jose have been red hot markets, supported in large part by strong job growth,” said Villacorta.
“The latest numbers reveal, however, that both markets have reached their apex in the most recent upward price swing and are projected to take a slight dip into negative territory through the second half of 2015, by -0.2% and -0.4%. While both markets are projected to have total 2015 yearly growth rates of around 3%, entering winter 2015-2016 on the down side is of great concern. What started as ‘red hot’ at the start of 2014 may end as ‘in the red’ come 2016,” continued Villacorta.


