This is the third year in a row that the share of first-time buyers declined, staying at the lowest point in nearly three decades, according to an annual survey released by the National Association of Realtors.
Instead of first-time buyers, the overall strengthening pace of home sales over the past year was driven more by repeat buyers with dual incomes.
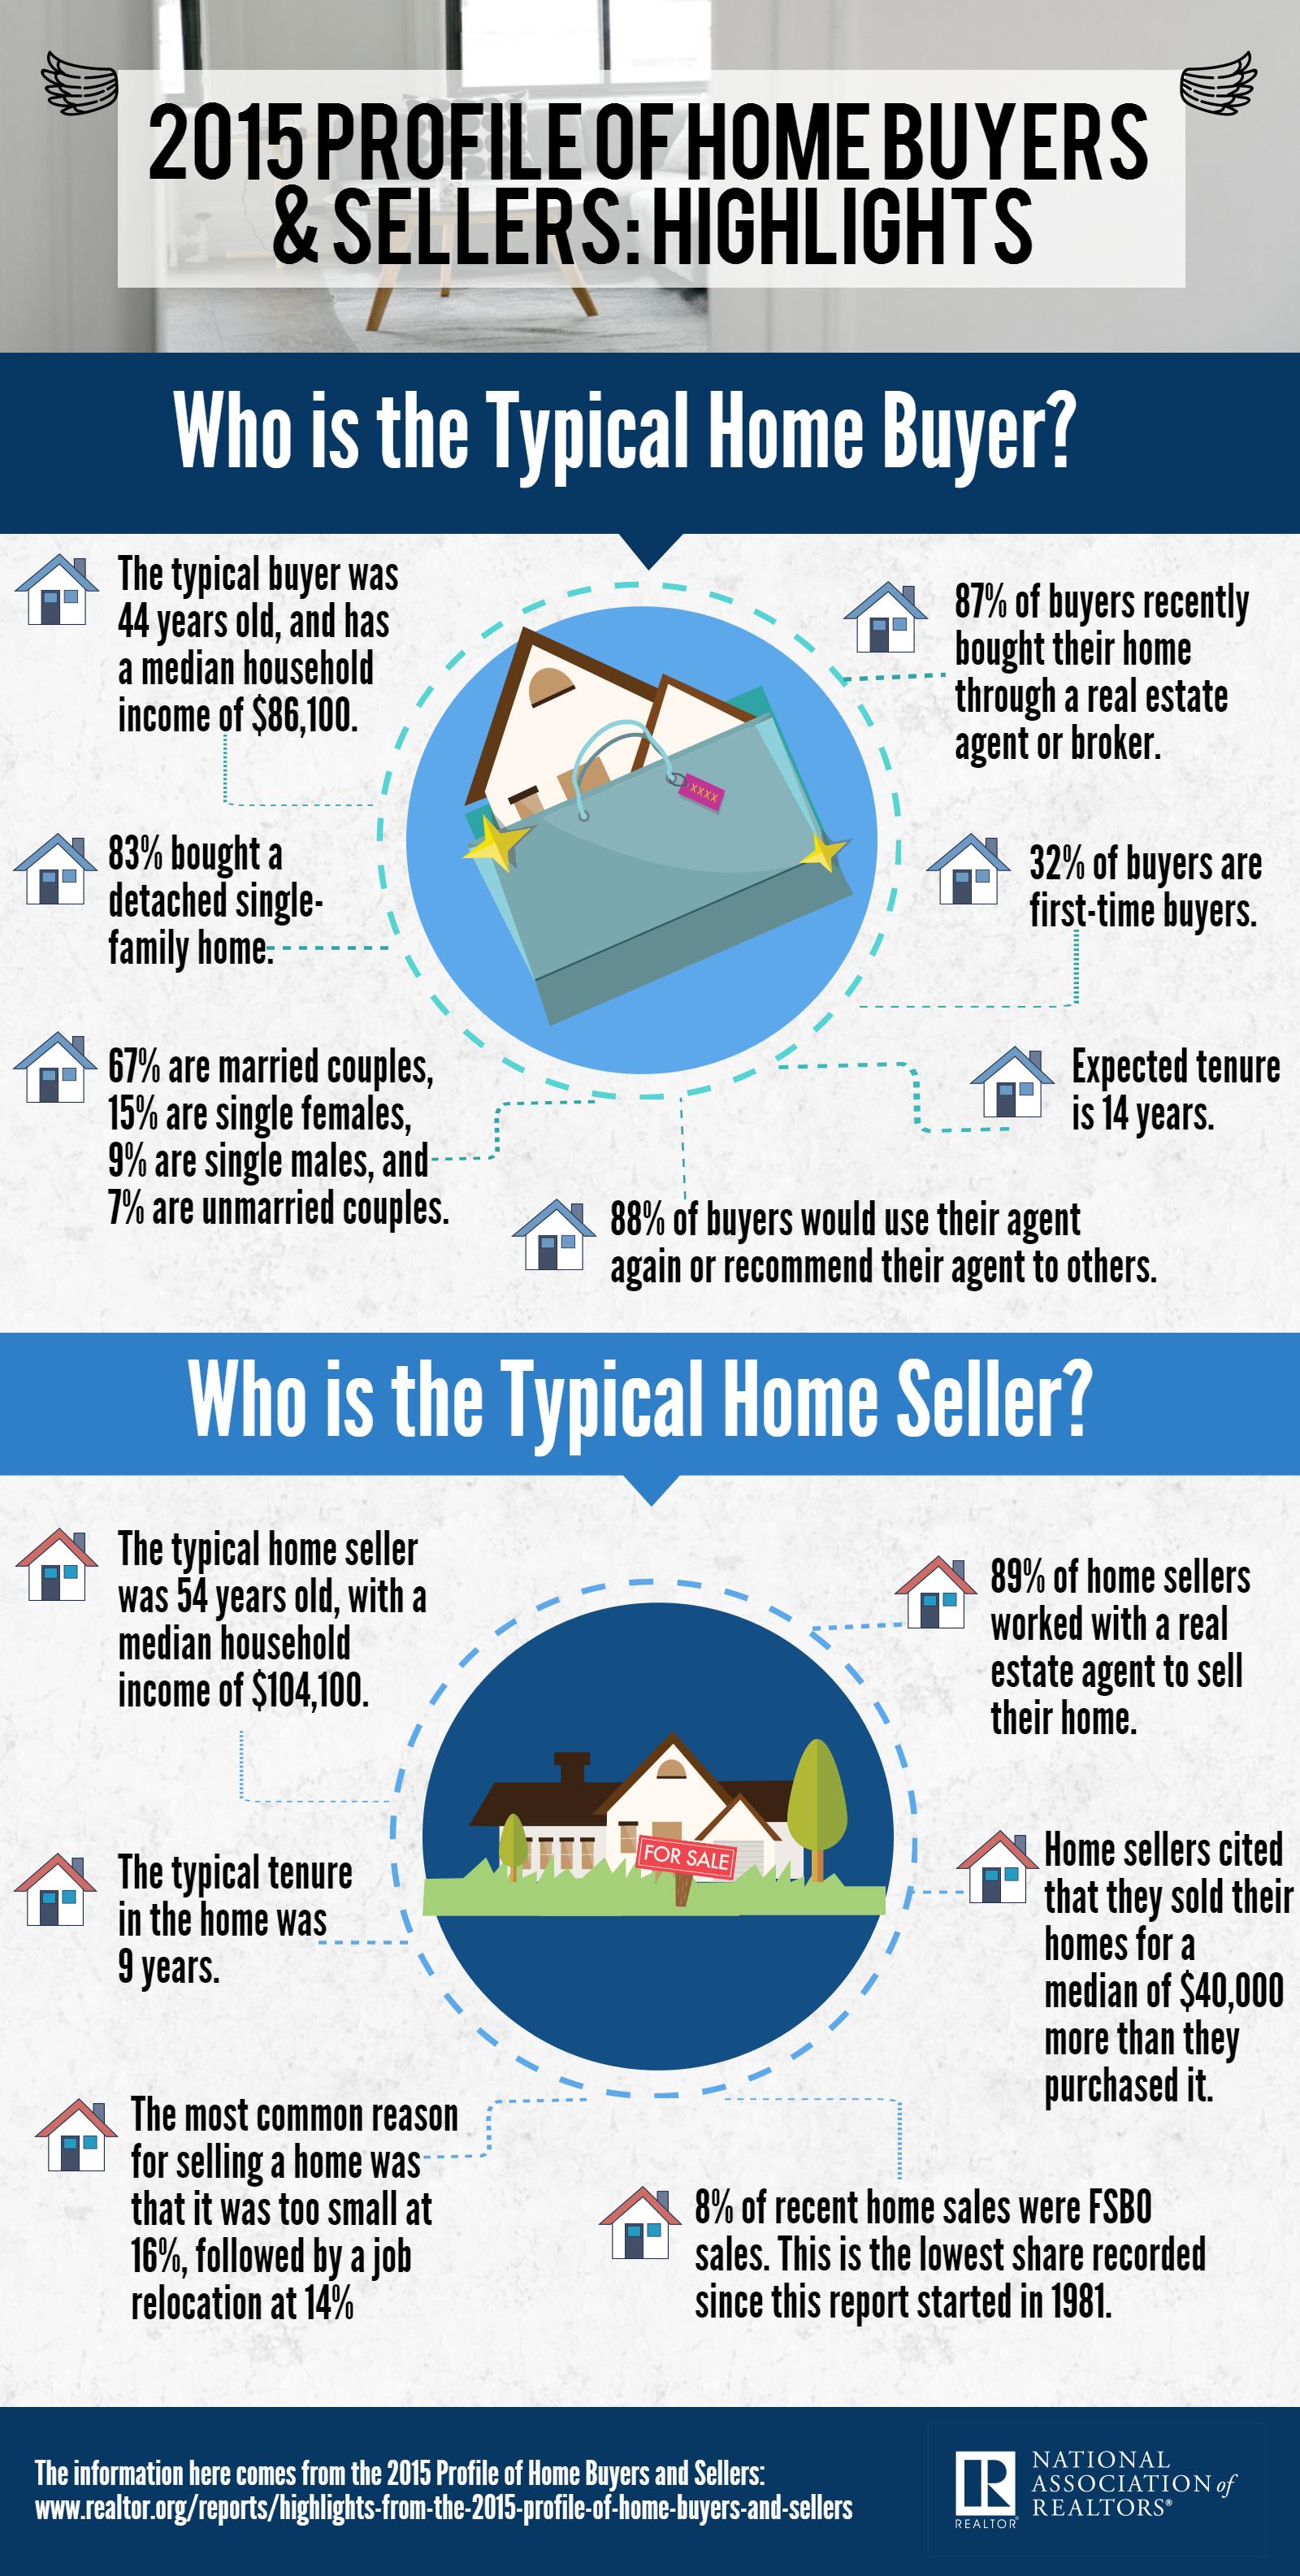
In this year’s survey, the share of first-time buyers declined to 32%å (33% a year ago), which is the second-lowest share since the survey’s inception (1981) and the lowest since 1987 (30%). Historically, the long-term average shows that nearly 40% of primary purchases are from first-time homebuyers.
Lawrence Yun, NAR chief economist, said the housing recovery’s missing link continues to be the absence of first-time buyers.
“There are several reasons why there should be more first-time buyers reaching the market, including persistently low mortgage rates, healthy job prospects for those college-educated, and the fact that renting is becoming more unaffordable in many areas,” said Yun.
He attributed the drop in first-time buyers to several reasons.
“Unfortunately, there are just as many high hurdles slowing first-time buyers down. Increasing rents and home prices are impeding their ability to save for a down payment, there’s scarce inventory for new and existing-homes in their price range, and it’s still too difficult for some to get a mortgage,” Yun said.
This infographic shows what the typical homebuyer and home seller look like.
Click to enlarge
(Source: National Association of Realtors)
The 2015 National Association of Realtors Profile of Home Buyers and Sellers continues a long-running series of large national NAR surveys evaluating the demographics, preferences, motivations, plans and experiences of recent home buyers and sellers; the series dates back to 1981.
The survey was conducted through a 128-question survey mailed in July 2015, using a random sample weighted to be representative of sales on a geographic basis. A total of 6,406 responses were received from primary residence buyers.


