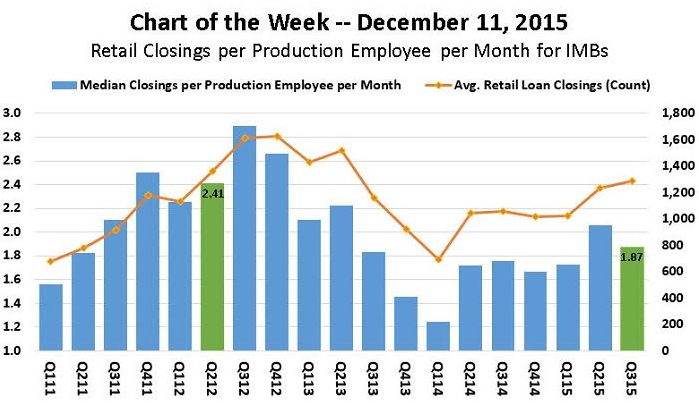
The latest chart of the week from the Mortgage Bankers Association puts the reality of today’s retail origination volume into perspective.
The median closings per production employee was 1.87 loans per month in the third quarter of 2015, which translates into about 22 loans per year.
Also, the average company retail volume for the quarter was about 1,300 loans.
From there, the MBA compared it to the second quarter of 2012 when retail origination volume was comparable. At that time, the median closings was 2.41 loans, which translates into about 29 loans per year.
According to the MBA, several factors may be driving the differences in productivity between these quarters: the elevated purchase share of loan closings in the third quarter of 2015, combined with slightly higher government share of loan closings and lower average FICO scores.
The MBA also said that increasing regulatory and other complexities affecting sales, fulfillment and production support staffing could be contributing to the decline.
Click to enlarge
(Source: MBA)
This chart presents a productivity benchmark for companies that originated loans primarily through the retail production channel – with no third party (broker or correspondent channel) originations – equal to approximately 220 companies in the third quarter.


