The share of homes bought in cash is on pace to hit an eight-year low after the first two months of the year saw the smallest portion of homes purchased in cash in the same time period since 2008, a new report from CoreLogic shows.
According to CoreLogic’s report, cash sales made up 35.7% of total home sales in February 2016, after coming in at 35.5% in January.
For the first two months of 2016, the cash sales share averaged 35.6%, the lowest start to any year since 2008.
February’s cash share total of 35.7% was down 2.5 percentage points year-over-year from 38.1% in February 2015.
For perspective, the cash sales share peaked in January 2011 when cash transactions accounted for 46.6% of total home sales nationally.
According to CoreLogic’s report, prior to the housing crisis, the cash sales share of total home sales averaged approximately 25%.
In its report, CoreLogic states that if the cash sales share continues to fall at the same rate it did in February 2016, the share should fall back to the pre-crisis average by mid-2018.
According to CoreLogic’s report, real estate-owned sales made up the largest cash sales share in February 2016, coming in at 59.2%. Resales had the next highest cash sales share at 35.6%, while short sales made up 32.6% and newly constructed homes came in at 15.2%.
CoreLogic noted that while the percentage of REO sales that were all-cash transactions remained high, REO transactions accounted for only 7.8% of all sales in February 2016.
By comparison, in January 2011 when the cash sales share was at its peak, REO sales represented 23.9% of total home sales.
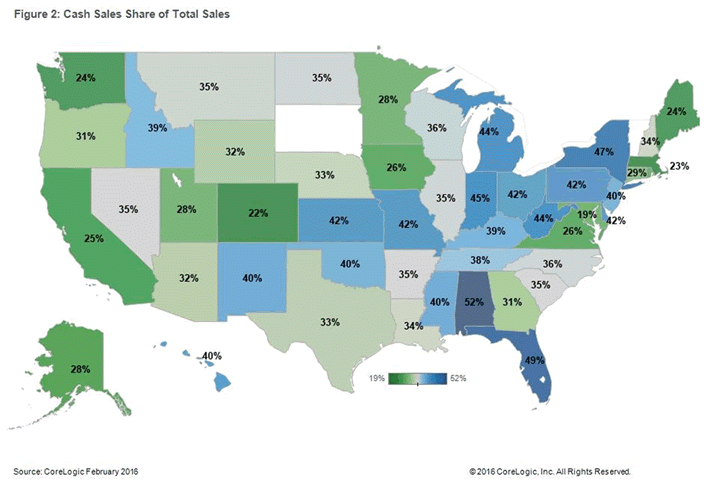
On a state-by-state basis, Alabama had the largest cash sales share of any state at 51.7%, followed by Florida (49.2%), New York (46.9%), Indiana (44.8%) and West Virginia (44.2%).
On a metro level, Philadelphia, Pa. had the highest cash sales share at 54.5%, followed by Detroit, Mich. (53.8%), West Palm Beach-Boca Raton-Delray Beach, Fla. (53.4%), Miami-Miami Beach-Kendall, Fla. (52.5%) and Cape Coral-Fort Myers, Fla. (51.8%).
Syracuse, N.Y. had the lowest cash sales share at 11.5%.
Click the map below to see the cash share for each state.
(Image courtesy of CoreLogic)


