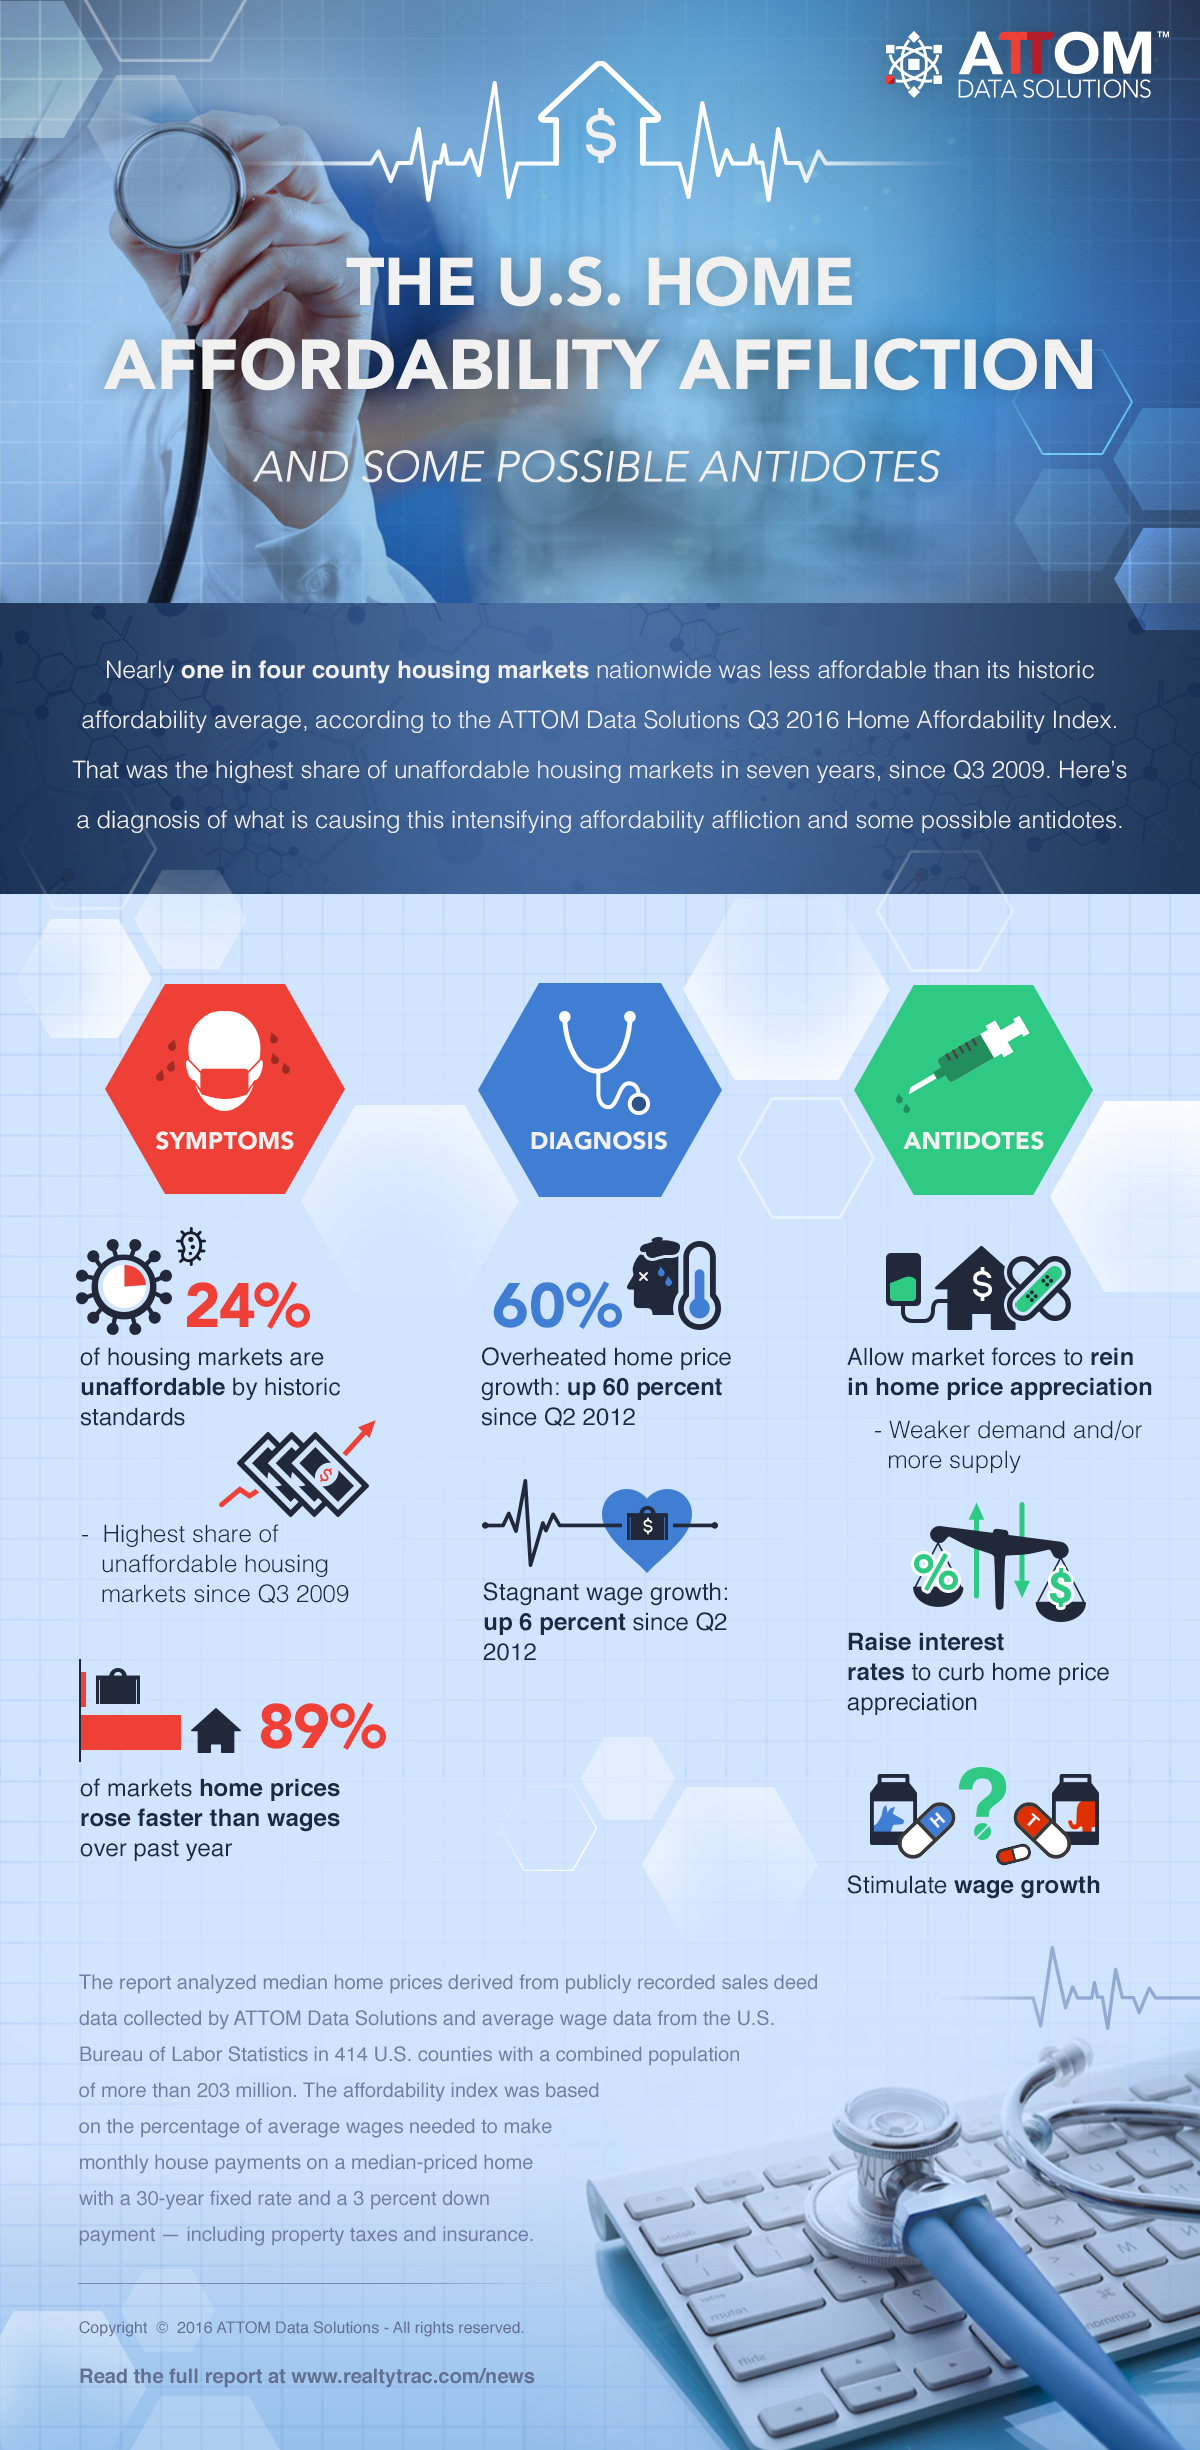
Home affordability is at the worst level in seven years, with 24% of the U.S. county housing markets less affordable than their historic affordability averages in the third quarter, the most recent ATTOM Data Solutions Home Affordability Index for third quarter 2016 recorded.
This level is not only up from 22% of markets in the previous quarter, but it is up from 19% of markets a year ago.
The only other time affordability came in worse than this was in third quarter of 2009 when 47% of markets were less affordable than their historic affordability averages.
The affordability index is based on the percentage of average wages needed to make monthly house payments on a median-priced home with a 30-year fixed rate and a 3% down payment — including property taxes and insurance.
“The improving affordability trend we noted in our second quarter report reversed course in the third quarter as home price appreciation accelerated in the majority of markets and wage growth slowed in the majority of local markets as well as nationwide, where average weekly wages declined in the first quarter of this year following 13 consecutive quarters with year-over-year increases,” said Daren Blomquist, senior vice president at ATTOM Data Solutions.
“This unhealthy combination resulted in worsening affordability in 63% of markets despite mortgage rates that are down 45 basis points from a year ago.
According to the report, out of the 414 counties analyzed in the report, 101 counties (24%) had an affordability index below 100 in the third quarter of 2016, meaning that buying a median-priced home in that county was less affordable than the historic average for that county going back to the first quarter of 2005.
Key counties highlighted include: Harris County (Houston), Texas; Kings County (Brooklyn), New York; Dallas County, Texas; Bexar County (San Antonio), Texas; and Alameda County, California in the San Francisco metro area.
Despite the negative news, Blomquist did point out one positive area.
“Some silver lining in this report is that affordability actually improved in some of the highest-priced markets that have been bastions of bad affordability, mostly the result of annual home price appreciation slowing to low single-digit percentages in those markets,” Blomquist continued.
He explained that this is an indication that home prices are finally responding to affordability constraints — a modicum of good news for prospective buyers who have been priced out of those high-priced markets.
This infographic from ATTOM Data Solutions shows the U.S. home affordability affliction and some possible antidotes.
Click to enlarge
(Source: ATTOM Data Solution)


