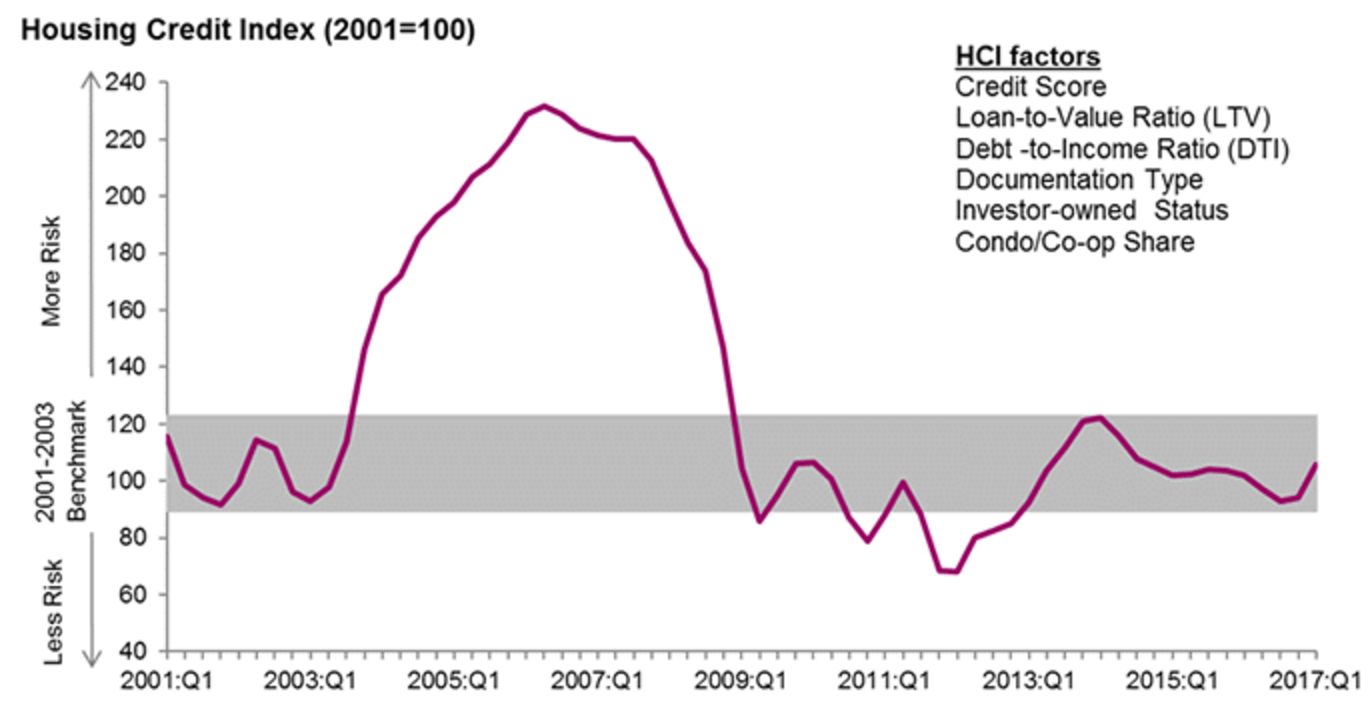
Mortgages became more risky in the first quarter of 2017, according to the Q1 2017 CoreLogic Housing Credit Index.
The index from CoreLogic, a property information, analytics and data-enabled solutions provider, measures trends in six home mortgage credit risk attributes. The HCI indicates the increase or decrease in credit risk for new home originations compared to the period before.
These six attributes include borrower credit score, debt-to-income ratio, loan-to-value ratio, investor-owned status, condo/co-op share and documentation.
Click to Enlarge
(Source: CoreLogic)
“Mortgage rates during the first quarter of 2017 were up about 0.5 percentage points from a year earlier,” CoreLogic Chief Economist Frank Nothaft said. “Since 2009, for every one-half percentage point increase in mortgage rates, the average credit score on refinance borrowers has dipped by nine points, and this pattern will likely continue if mortgage rates move higher.”
“That is because when rates rise, applications drop off and loan officers spend more time with the applicants that have less-than-perfect credit scores, require more documentation or have unique property issues,” Nothaft said.
During the first quarter, the HCI increased to 105.6, an increase of 3.6 points from the first quarter of 2016. However, even after the increase, the level of credit risk in the first quarter was nearly the same as the average 105.9 for the period of 2001 to 2003, a time which is considered to be a normal baseline for credit risk.
Over the past year, the index showed a loosening, partly due to a shift in the mix of purchase loans, which are more risky, versus refinance originations.
Beginning in Q1 2017, the HCI was revised to include a more comprehensive source of loan-level, non-agency, mortgage-backed securities data. The result is that the HCI more accurately captures the loans that exhibited higher risk features during the mid-2000s.
“Overall credit risk for purchase loans was slightly higher compared with a year ago as the investor share and condo/co-op share increased,” Nothaft said. “These increases offset lower-risk signals from the credit score, DTI and LTV attributes to result in an uptick in overall riskiness. Still, overall risk is similar to that of the early 2000s.”
Here are the changes to the six attributes:
Credit Score: The average credit score for homebuyers increased 7 points year over year between Q1 2016 and Q1 2017, rising from 734 to 741. In Q1 2017, the share of homebuyers with credit scores under 640 was less than 3% compared with 25% in 2001.
Debt-to-Income: Holding steady at 36%, the average DTI for homebuyers in Q1 2017 was similar to Q1 2016. In Q1 2017, the share of homebuyers with DTIs greater than or equal to 43% was 24%, down slightly from 25% in Q1 2016, but up from 18% in 2001.
Loan-to-Value: The LTV for homebuyers fell by 1.7 percentage points between Q1 2016 and Q1 2017 from 87.6% to 85.9%. In Q1 2017, the share of homebuyers with an LTV greater than or equal to 95% was 43%, down from 49% in Q1 2016 and up from 29% in 2001.
Investor Share: The investor share of home-purchase loans increased from 4% in Q1 2016 to 5% in Q1 2017.
Condo/Co-op Share: The share of home-purchase loans secured by a condominium or a co-op building increased from 10% in Q1 2016 to 12% in Q1 2017.
Documentation Type: Low- or no-documentation loans remained a small part of the mortgage market, increasing from 2% to 3% of home-purchase loans during the past year.


