Foreclosure activity deviated from its recent trend, posting the first quarterly increase in two years, according to the Office of the Comptroller of the Currency’s latest quarterly report on mortgages. Nonetheless, the report found the overall performance of currently serviced (not in foreclosure) mortgages this quarter continued to improve.
The OCC collects data on first-lien residential mortgage loans serviced by seven national banks with large mortgage-servicing portfolios. The seven national banks include: Bank of America, Citibank, HSBC, JPMorgan Chase, PNC, U.S. Bank and Wells Fargo. However, data through the fourth quarter of 2015 includes CIT/OneWest.
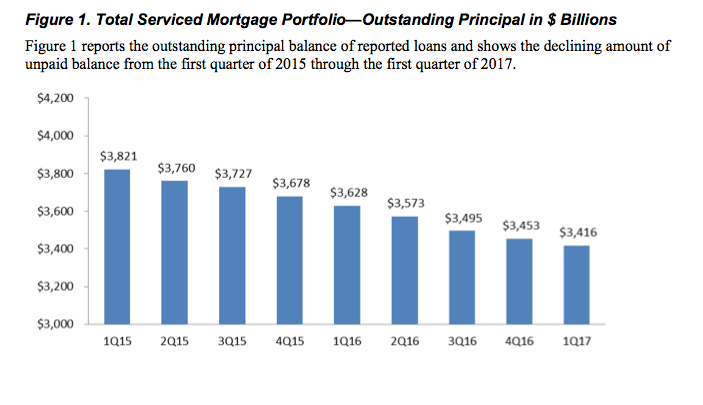
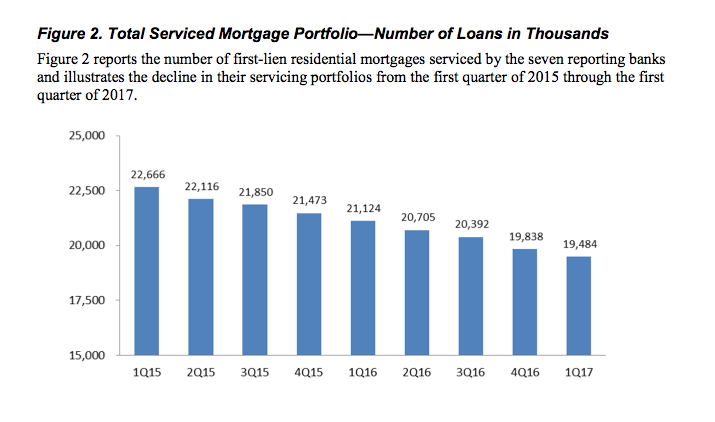
For context, the banks above only make up 35% of all residential mortgages outstanding in the United States or approximately 19.5 million loans totaling $3.42 trillion in principal balances.
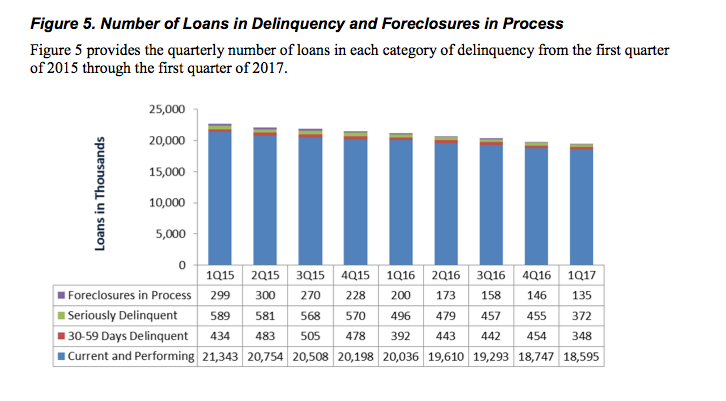
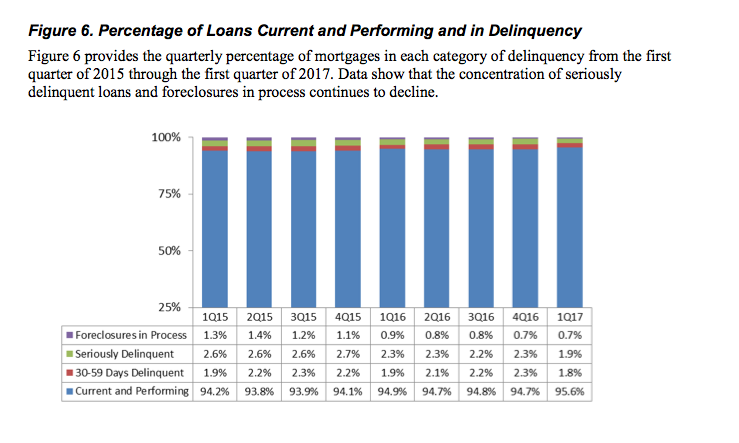
Similar to past reports, the report found that the overall performance of mortgages this quarter showed continued improvement from a year earlier, as seen in the chart below.
The latest report showed 95.6% of mortgages included in the report were current and performing at the end of the quarter, up from 94.9% a year earlier.
The following two charts break down the data by outstanding principal balance and number of loans in thousands.
Click to enlarge
(Source: OCC)
Click to enlarge
(Source: OCC)
The report clarified that servicers initiate foreclosure actions at defined stages of loan delinquency.
Foreclosure actions progress to sale of the property only when servicers and borrowers cannot arrange a permanent loss mitigation action, modification, home sale, or alternate workout solution.
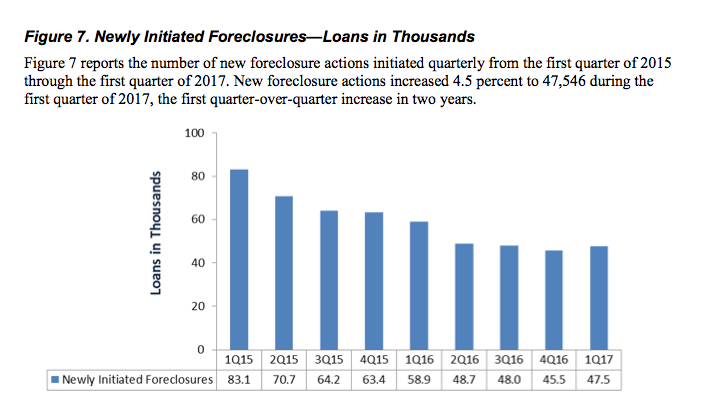
Meanwhile, the chart below shows the recent trend in servicers initiating the foreclosure process, which came to a slight halt this quarter.
As seen in the chart below, servicers initiated 47,546 new foreclosures in the first quarter of 2017, an increase of 4.5 percent from the previous quarter and decrease of 19.3 percent from a year earlier.
Click to enlarge
(Source: OCC)
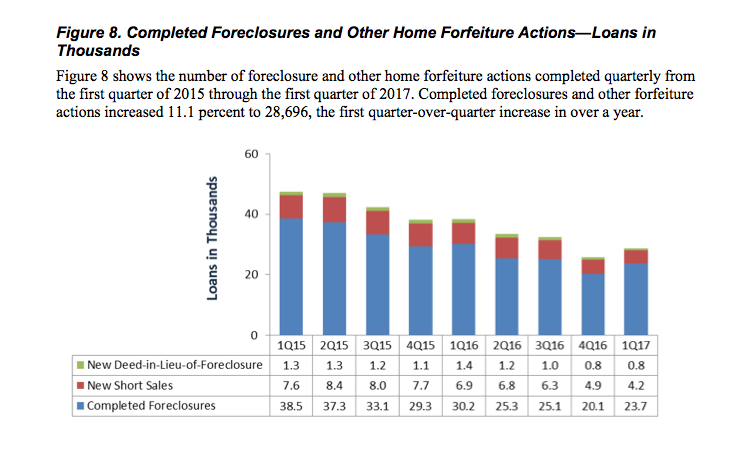
In addition, home forfeiture actions during the quarter—completed foreclosure sales, short sales, and deed-in-lieu-of-foreclosure actions— fell 25.3% from a year earlier to 28,696.
Click to enlarge
(Source: OCC)
Lastly, the following two charts break down the percentage and the number of loans in current and performing and in delinquency.
Click to enlarge
(Source: OCC)
Click to enlarge
(Source: OCC)


