The national homeownership rate increased slightly from last year, but was not statistically different from last quarter, according to the latest release from the U.S. Census Bureau.
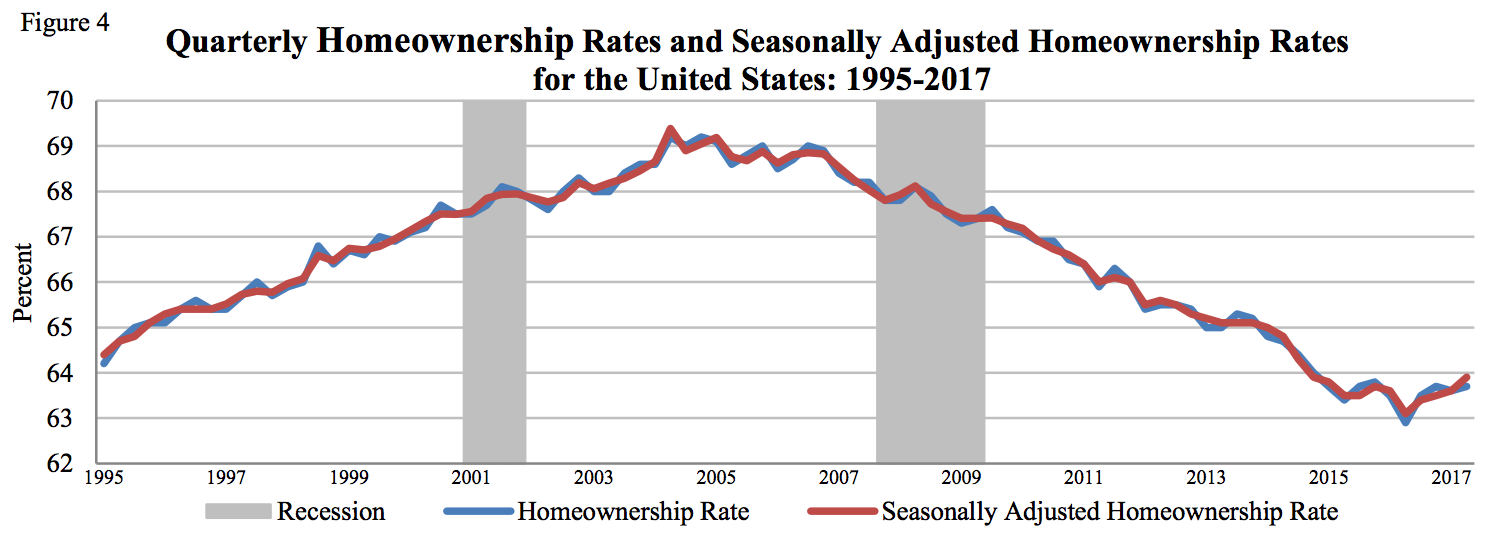
The homeownership rate in the second quarter came in at 63.7%, up 0.8 percentage points from last year’s 62.9% but only 0.1 percentage points from the first quarter’s 63.6%.
Click to Enlarge
(Source: U.S. Census Bureau)
Last year’s 62.9% represented the lowest rate for homeownership since 1965. Since then, the homeownership rate hovered close to this 50-year low.
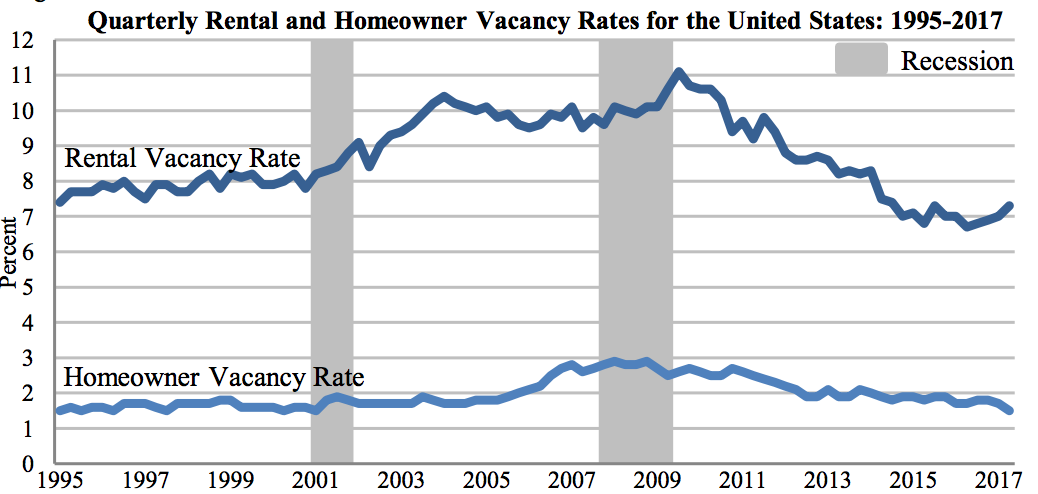
The Census Bureau report also showed that national vacancy rates for rental housing increased in the second quarter to 7.3%. This is up 0.6 percentage points from 6.7% last year and up 0.3 percentage points from last quarter’s 7%.
On the other hand, the homeowner vacancy rate decreased 0.2 percentage points from the second quarter 2016 and the first quarter this year to 1.5%, which is the lowest level since the first quarter of 2001.
The homeownership vacancy rate inside principal cities rests even lower at 1.4%, the lowest level since the fourth quarter of 1980, when the rate also sat at 1.4%.
Click to Enlarge
(Source: U.S. Census Bureau)
Surprisingly, despite being the most affected by rapidly rising home prices and fierce competition in the housing market, Millennials were the only generation to see an increase in their homeownership rate from last quarter.
The homeownership rate for those under 35 years of age increased a full percentage point from last quarter’s 34.3% to 35.3% in the second quarter, which is the highest level since the third quarter of 2015. For comparison, here are the changes in the homeownership rate for other age groups:
35 to 44 years: Decreased 0.2 percentage points to 58.8%
45 to 54 years: Decreased 0.1 percentage point to 69.3%
55 to 64 years: Decreased 0.2 percentage points to 75.4%
65 years and older: Decreased 0.4 percentage points to 78.2%
Comparing race and ethnicity of the household, whites were the only ones to see an increase in their homeownership rate. The homeownership rate among whites increased 0.4 percentage points to 72.2% in the second quarter.
Here are the rates among other races for comparison, all of which saw a decrease in the second quarter:
Asian, Native, Hawaiian and Pacific Islander: Decreased 0.3 percentage points to 56.5%
Hispanic: Decreased 1.1 percentage points to 45.5%
Black: Decreased 0.4 percentage points to 42.3%
The decrease in Hispanic homeownership eraseed all gains made in the third quarter last year, when the homeownership rate hit 47%. In fact, last year, Hispanics were the only group to see a surge in homeownership.
The Census Bureau also reports the homeownership rate for all races not mentioned above under “other.” This rate increased 0.7 percentage points to 54.3% in the second quarter.
Included in this “other” population is multiracial Americans, a sector that is growing at three times the rate of the U.S. population as a whole, according to a study from the Pew Research Center.
In 2013, about 9 million Americans chose two or more categories when the U.S. Census Bureau asked about their race, and the share of multiracial babies increased from 1% in 1970 to 10% in 2013 – a growth that the Pew expects to continue increasing.


