The days of a refinance-driven mortgage market are quickly coming to an end. Luckily for us, the share of purchase applications will start to take over, according to several sets of recently released data, detailed below.
But there's a downside, with the shift to purchase applications, fraud risk is expected to keep rising, too.
And the latest report from CoreLogic backs this up, adding that mortgage fraud risk is only projected to increase moving forward.
The CoreLogic Mortgage Fraud Report analyzes the collective level of loan application fraud risk the mortgage industry is experiencing each quarter. CoreLogic develops the index based on residential mortgage loan applications processed by CoreLogic LoanSafe Fraud Manager, a predictive scoring technology.
Pulling out only the data on purchase applications, from Q2 2016 to Q2 2017, the proportion of purchase transactions within the consortium increased from 55% to 66% of applications. CoreLogic attributed this trend to the continued shift from what had been a very refinance-heavy market to a purchase market.
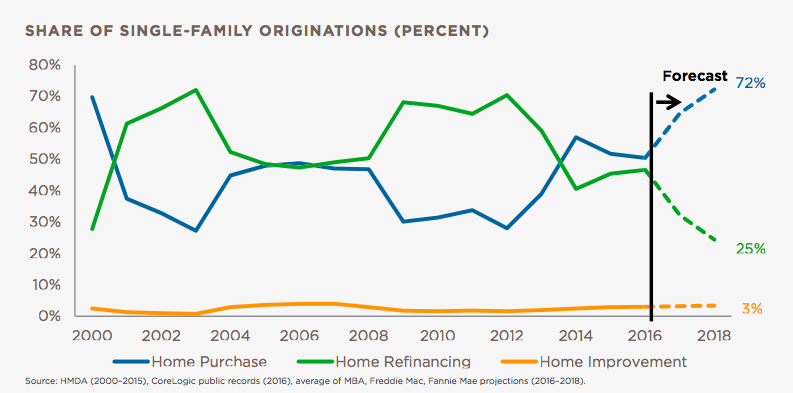
The chart below shows how the share single-family originations have fluctuated since 2000. By 2018, CoreLogic forecasts that refinance applications will make up only 25% of applications, while purchase applications will make up 72% of applications.
Click to enlarge
(Source: CoreLogic)
There is another major factor that is fueling the increase in fraud: wholesale lending.
CoreLogic explained that the second factor leading to an increase in fraud risk was a 48% increase in the share of loans originated through wholesale channels, from 5% to 7.3%.
But it’s important to note that traditionally, wholesale applications have shown a higher risk level than retail channels.
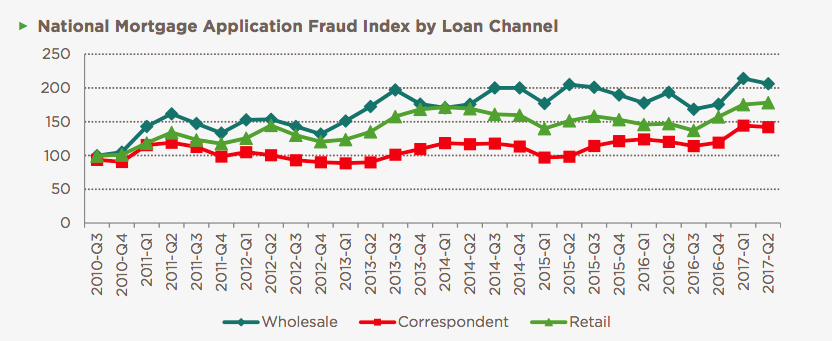
The chart below breaks down the national mortgage application fraud index by loan channel, with the wholesale lending channel consistently having the largest share of risk.
Click to enlarge
(Source: CoreLogic)
Even with the increase in risk in purchase application and the wholesale lending channel, this doesn’t mean refinance applications are risk-free. The refinance segments also showed risk increases, most notably in the jumbo segment, where the risk index increased 59% while volumes decreased by 35%.
CoreLogic added that specific risk indicators that increased for jumbo refinances during the last year included rapid refinancing after purchase, home value appreciation not supported by market changes, and occupancy red flags.
As a whole, during the second quarter of 2017, an estimated 13,404 mortgage applications or 0.82% of all mortgage applications contained fraud. This is compared to the second quarter of 2016 when mortgage application fraud was found on 12,718 applications, or 0.7% of all applications.
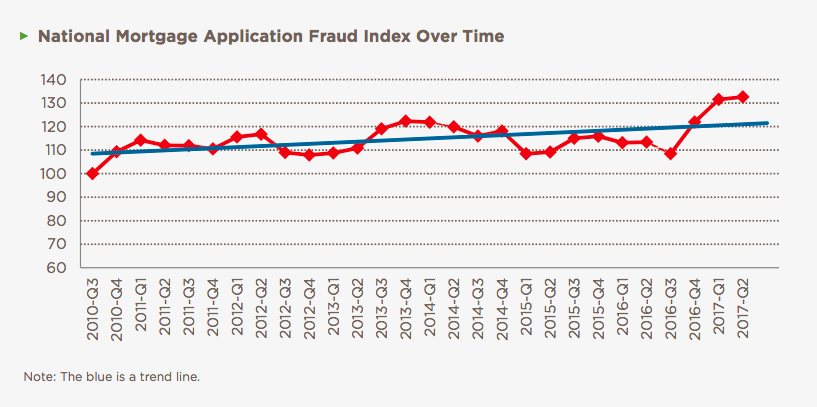
In addition, the CoreLogic Mortgage Application Fraud Risk Index increased 16.9% nationally from the second quarter 2016 to the second quarter of 2017.
The chart below shows the Mortgage Application Fraud Risk Index over time.
Click to enlarge
(Source: CoreLogic)
“This past year we saw a relatively large increase in the CoreLogic National Mortgage Application Fraud Index,” said Bridget Berg, principal, fraud solutions for CoreLogic. “If the factors that influenced the increase continue, including a shift to purchase transactions and growing wholesale channel origination activity, it is likely that mortgage application fraud risk will continue to rise as well.”
So where is this increase in fraud risk mainly coming from? CoreLogic pinpointed three mortgage fraud indicators that are on the rise.
1. Occupancy fraud risk
In the No. 1 spot, CoreLogic explained that occupancy fraud occurs when mortgage applicants deliberately misrepresent their intended use of a property (primary residence, secondary residence, or investment).
From the second quarter of 2016 to the second quarter of 2017, the occupancy- fraud indicator grew 7%. However, this risk isn’t new and has been steadily increasing over the last year.
2. Transaction fraud risk
Rising at the end of the second quarter of 2017, the transaction risk indicator increased 3.9% when compared to the same quarter last year, with a steady increase each quarter.
Transaction fraud occurs when the nature of the transaction is misrepresented, such as undisclosed agreements between parties and falsified down payments.
3. Income risk fraud
Rounding out the list, income fraud includes misrepresentation of the existence, continuance, source, or amount of income used to qualify.
From the second quarter of 2016 to the second quarter of 2017, the income fraud risk indicator increased 3.5%.
For a broader overview of mortgage fraud in the market, the chart below gives the latest data from the United States Department of the Treasury Financial Crimes Enforcement Network. While appraisal fraud, foreclosure fraud, reverse mortgage fraud barely changed, the other category significantly shot up, moving from 45 in 2014 to 2,207 in 2016.
Click to enlarge

(Source: FinCEN)


