The single-family rental market is now past 200,000 properties owned by institutional capital. And this is probably a low estimate, with the latest numbers coming out only for the year 2016, according to a new white paper from Amherst Capital Management, a BNY Mellon investment boutique specializing in U.S. real estate.
This means that total institutional investment in SFR homes is about $33 billion as of 2016. Nonetheless, while media outlets sometimes refer to the "Wall Street" landlord when discussing SFR, the final data point below proves the market remains very diverse.
Amherst noted in its report that the since the number are derived from county record data based on buyer name tagging, they may not cover all purchases by the listed institutional buyers.
The company tracks properties in the county record and transaction data from Corelogic that are owned by institutional pools of capital by identifying buyers allied with each of them.
Using the data, Amherst created the following charts to show how the SFR has shifted geographically and by investor size.
Sandeep Bordia, head of research and analytics at Amherst Capital, explained, “Institutional activity in the SFR market continues to increase, driven by relatively attractive valuations, modestly strong home price appreciation and stable financing.”
“Our data shows that newer entrants and mid-sized institutions accounted for the majority of institutional SFR home purchases over the last year, compared to a slowdown in buying activity among larger institutional holders,” said Bordia. “We believe that evolving demographics, financial factors and shifting consumer preferences, will keep demand for SFR homes elevated over the coming years.”
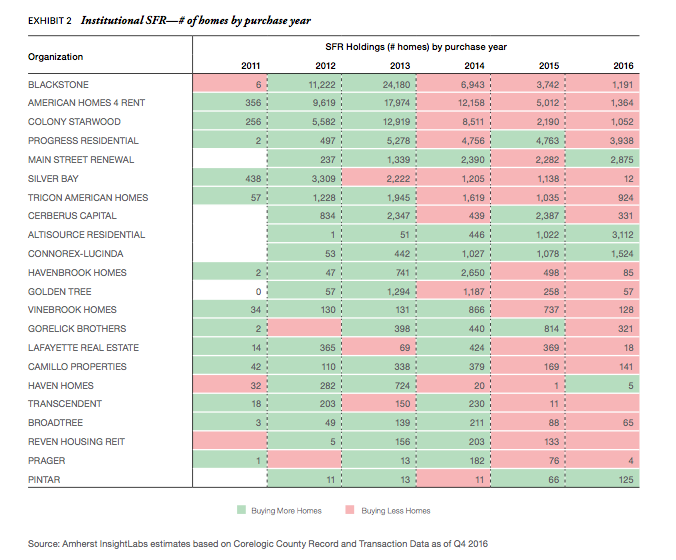
These first two charts break down how the main players in the SFR space have shifted.
The biggest institutional players (such as Blackstone, American Homes 4 Rent [“AH4R”] and Colony/Starwood) slowed their purchasing in 2015–2016, while the mid- sized players (such as Progress, Main Street Renewal, Altisource and Connorex) were more active in 2015– 2016 versus prior years.
The second chart looks at the same data but by market share for year of purchase.
Click to enlarge
(Source: Amherst InsightLabs estimates based on Corelogic County Record and Transaction Data as of Q4 2016)
Click to enlarge
(Source: Amherst InsightLabs estimates based on Corelogic County Record and Transaction Data as of Q4 2016)
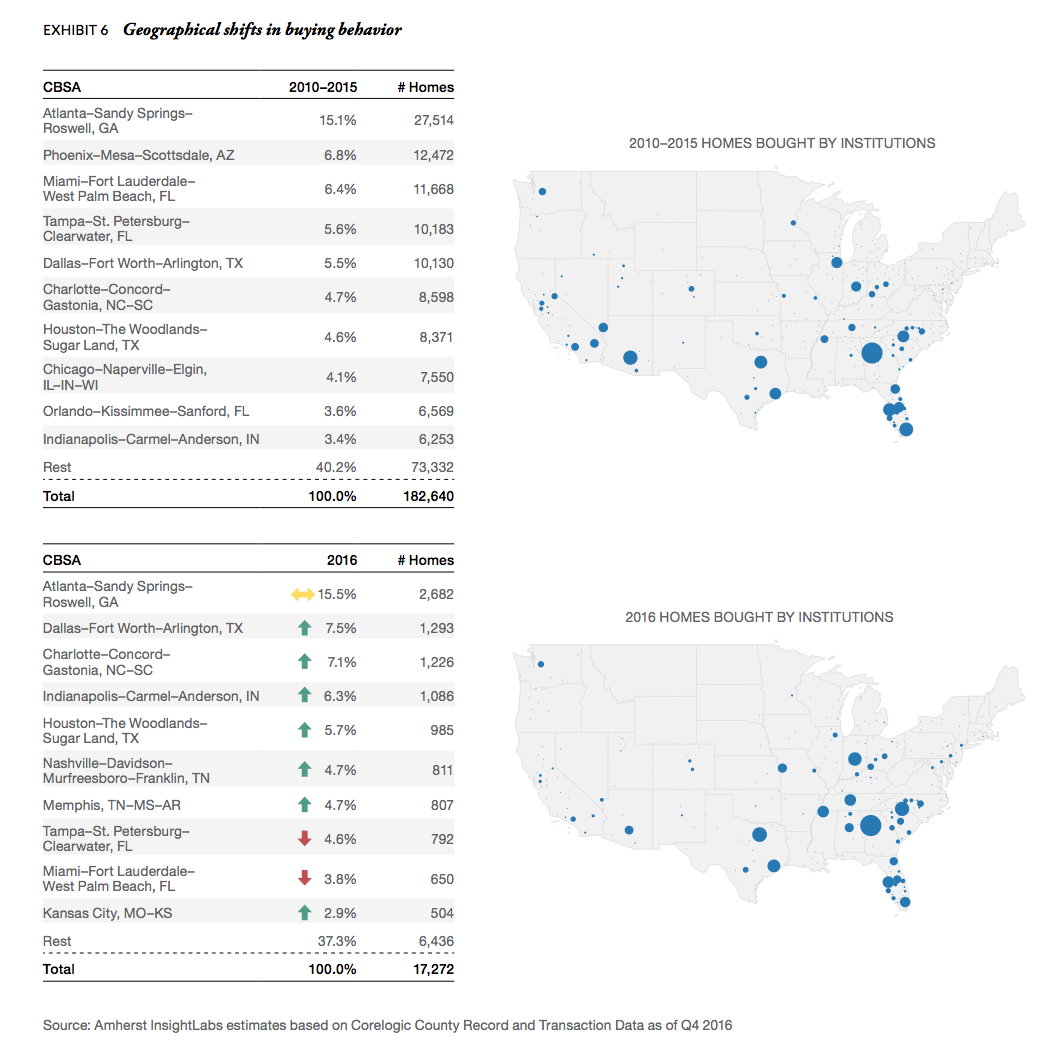
These next two charts show the geographical shift of where institutional investors are buying.
While the West had historically seen interest from early entrants in this space, as those institutions’ share of total purchases fell, so did the West’s proportion within all institutional purchases.
As an added noted, the color-coded arrows in the bottom left indicate metro areas where share has increased, fallen or stayed roughly the same in 2016 from prior years.
Click to enlarge
(Source: Amherst InsightLabs estimates based on Corelogic County Record and Transaction Data as of Q4 2016)
Overall, while the SFR market sits at $33 billion, it’s still only a small drop in the bucket compared to the total value of single-family homes, which is estimated at about $26 trillion.
This means that even among the 15 million or so single-family rentals, institutions own less than 2%.


