The national homeownership rate continued its slow trek back above last year’s historic lows in the third quarter, rising to levels not seen since 2014.
The latest data from the U.S. Census Bureau, released Tuesday morning, shows that the homeownership rate rose to 63.9% in the third quarter from 63.7% in the second quarter. In last year’s third quarter, the homeownership rate was 63.5%.
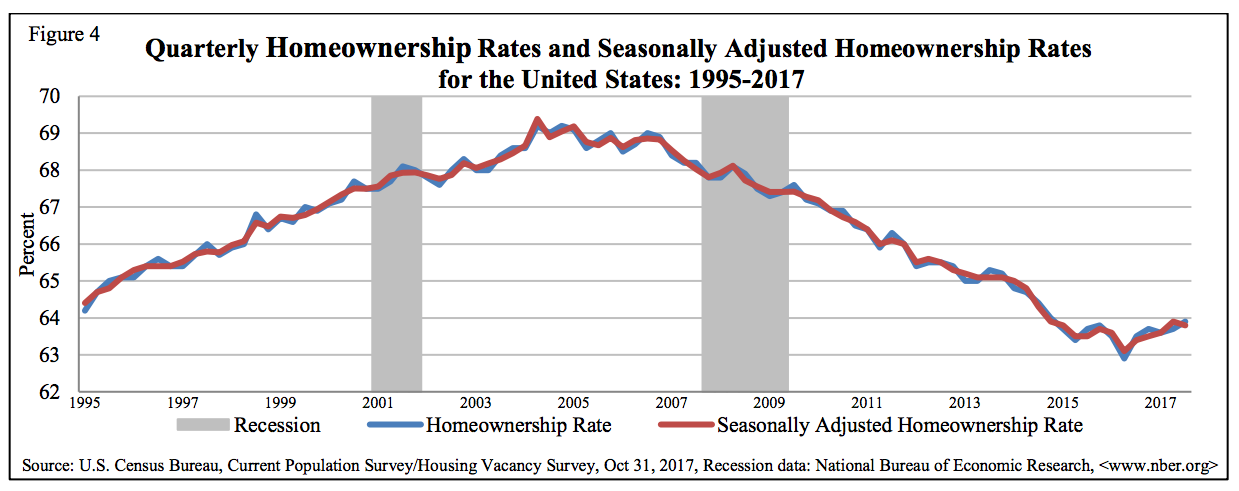
While the Census Bureau notes that neither increase was “statistically different,” the homeownership rate is now a full percentage point above 2016’s second quarter, when the homeownership rate fell to it lowest level since 1965.
Before falling to that historic low, the homeownership rate trended down since it peaked above 69% during the height of the housing boom.
But now, the downward trend appears to be finally turning in a positive direction with the homeownership rate climbing, albeit modestly, over the last several quarters – as seen in the chart below.
(Click the image to enlarge. Courtesy of the Census Bureau)
On a seasonally adjusted basis, the homeownership rate actually fell in the third quarter, but only by one basis point, from 63.9% in the second quarter to 63.8% in the third quarter. In 2016’s third quarter, the seasonally adjusted homeownership rate was 63.4%.
According to the Census Bureau, when adjusted for seasonal variation, the third quarter 2017 homeownership rate was not statistically different from the rates in the third quarter 2016 or the second quarter 2017.
Broken down geographically, it appears that much of the increase came from the Midwest, where the homeownership rate rose from 68% in the second quarter to 69.1% in the third quarter. During last year’s third quarter, the Midwest homeownership rate was 68.6%.
The homeownership rate in the Northeast (60.4%), South (65.5%), and West (58.9%) all held steady from the second quarter.
Another positive in the report is that it appears that more Millennials are buying homes. The homeownership rate for those under 35 rose to 35.6%, marking its third consecutive quarterly increase.
In fact, the third-quarter homeownership rate for those under 35 was the highest it’s been since the third quarter of 2015.
In the other age buckets, the homeownership rate for those 35-44 rose from 58.8% in the second quarter to 59.3% in the third quarter. In 2016’s third quarter, the homeownership rate for those aged 35-44 was 58.4%.
The homeownership rate decreased slightly for those 45-54 and 55-64, falling from 69.3% in the second quarter to 69.1% in the third quarter for those 45-54, and from 75.4% to 75% for those 55-64 during the same time period.
The homeownership rate for those 65 and over actually increased in the third quarter, climbing to 78.9% from 78.2% in the second quarter. In last year’s third quarter, the homeownership rate for those 65 and over was 79%.
The Census report also breaks homeownership down by race. From the report:
For homeownership rates by race, the third quarter 2017 homeownership rate for non-Hispanic White Alone householders reporting a single race was highest at 72.5%. The rate for Asian, Native Hawaiian and Pacific Islander Alone householders was second at 57.1% and Black Alone householders was lowest at 42%. The homeownership rate for non-Hispanic White Alone householders was higher than the third quarter 2016 rate, while the rates for Asian, Native Hawaiian and Pacific Islander Alone and Black Alone householders were not statistically different from the third quarter 2016 rates. The homeownership rate for Hispanic householders (who can be of any race), 46.1%, was not statistically different from the third quarter 2016 rate.
The Census report also provides vacancy rates for both rentals and owner-occupied properties.
According to the report, approximately 87.1% of the housing units in the United States in the third quarter 2017 were occupied and 12.9% were vacant. Owner-occupied housing units made up 55.7% of total housing units, while renter-occupied units made up 31.4% of the inventory in the third quarter 2017. Vacant year-round units comprised 9.9% of total housing units, while 2.9% were for seasonal use.
Additionally, the report showed that national vacancy rates in the third quarter 2017 were 7.5% for rental housing and 1.6% for homeowner housing.
The rental vacancy rate of 7.5% was 0.7 percentage points higher than the rate in the third quarter 2016 (6.8%) and not statistically different from the rate in the second quarter 2017 (7.3%). The homeowner vacancy rate of 1.6% was 0.2 percentage points lower than the rate in the third quarter 2016 (1.8%) and not statistically different from the rate in the second quarter 2017 (1.5%).
“Housing costs are rising, competition among buyers is fierce and the number of homes actually available to buy is at historic lows – and still, the U.S. homeownership rate is on the rise, climbing for the second straight quarter to its highest level since 2014 and proving American home buyers are nothing if not tenacious and resourceful,” Zillow Chief Economist Svenja Gudell said of the day’s news.
“If what we were seeing was largely existing homeowners trading properties between themselves, homeownership would be flat or falling. That it is rising, however modestly, proves that there is new blood entering the housing market, that renters are finding ways to transition into homeownership and more people are striking out on their own,” Gudell continued.
“The increase in the rental vacancy rate in Q3 provides further evidence of this shift back toward homeownership,” Gudell added. “This is encouraging, and bodes well for the continued health of the housing market overall. But this progress is by no means certain, and homeownership could still easily slide backwards if the market can’t build on today’s progress.”


