Home price increases picked up the pace once again in October, especially in the Pacific region, according to the latest House Price Index from the Federal Housing Finance Agency.
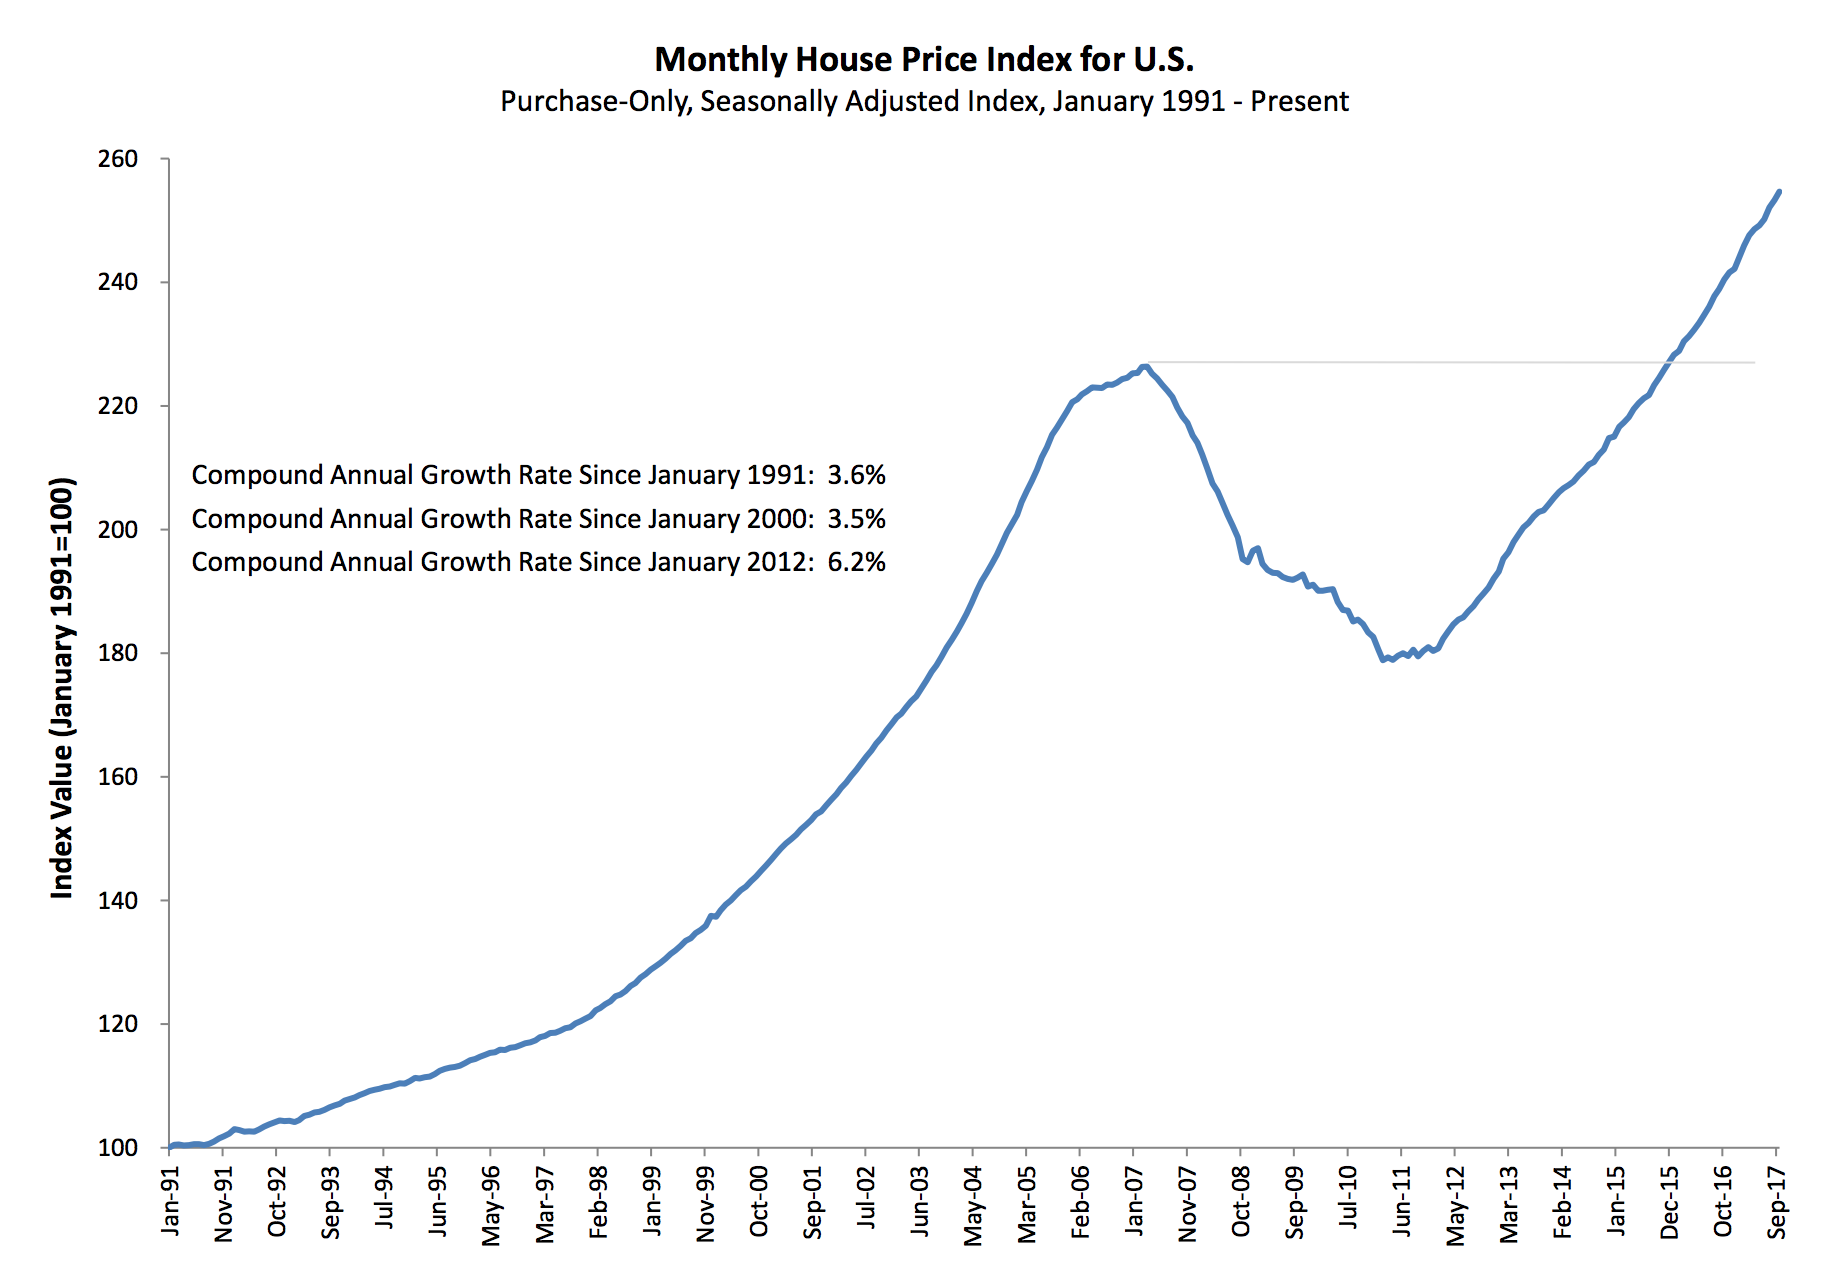
Home prices increased in October, up 0.5% from the previous month, the HPI showed. September’s estimate was revised up from an increase of 0.3% to an increase of 0.5%. Annually, home prices increased a full 6.6%.
But in some regions, that increase was much higher.
The chart below shows home prices continue to rise, unchecked since 2012, and have long since surpassed their previous high.
Click to Enlarge
(Source: FHFA)
The FHFA monthly HPI is calculated using home sales price information from mortgages sold to, or guaranteed by, Fannie Mae and Freddie Mac. Because of this, the selection excludes high-end homes bought with jumbo loans or cash sales.
Regionally, the increases from September to October ranged from a drop of 0.4% in the West North Central division to an increase of 2.8% in the East South Central division. But annually, all regions saw an increase, ranging from an increase of 4.8% in the West North Central division to an increase of 8.7% in the Pacific division.
Here is a list of which states are in each of those divisions:
West North Central: North Dakota, South Dakota, Minnesota, Nebraska, Iowa, Kansas, Missouri
East South Central: Michigan, Wisconsin, Illinois, Indiana, Ohio
Pacific: Hawaii, Alaska, Washington, Oregon, California


