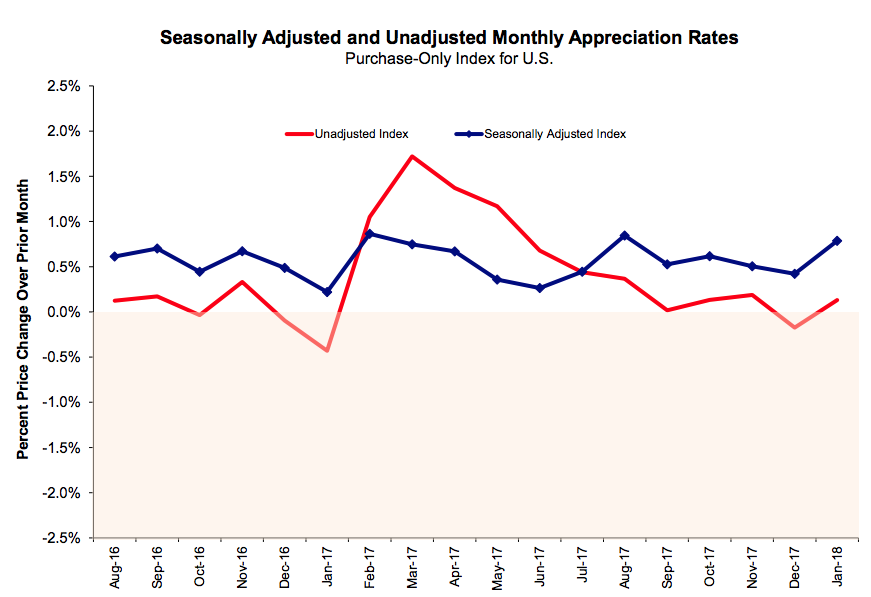
Home prices increased in January, moving even faster than the levels of increase seen at the end of 2017, according to the latest House Price Index from the Federal Housing Finance Agency.
Home prices increased by 0.8% from December to January, the index showed. And December’s increase of 0.3% was upwardly revised to 0.4%.
The chart below showed January’s increase in home prices was the highest monthly increase since February 2017, when home prices also rose 0.8%. August came close with an monthly increase of 0.7%.
Click to Enlarge
(Source: FHFA)
The FHFA monthly HPI is calculated using home sales price information from mortgages sold to, or guaranteed by, Fannie Mae and Freddie Mac. Because of this, the selection excludes high-end homes bought with jumbo loans or cash sales.
Home prices saw the most monthly increases on the coasts, both the East and West Coast.
Across the U.S., changes in home prices from December to January ranged from a decrease of 0.7% in the West South Central division to an increase of 1.2% in the New England and Pacific divisions.
Annually, all home price changes were positive, ranging from an increase of 5.1% in the West South Central division to an increase in the double digits of 10% in the Mountain division.
West South Central: Oklahoma, Arkansas, Texas and Louisiana
New England: Maine, New Hampshire, Vermont, Massachusetts, Rhode Island and Connecticut
Pacific: Hawaii, Alaska, Washington, Oregon and California
Mountain: Montana, Idaho, Wyoming, Nevada, Utah, Colorado, Arizona and New Mexico


