Reverse Market Insight (RMI) points to an interesting contradiction in their latest Retail Leaders Report for January 2011. Although volume decreased by 1.4% from December and by 15.3% from the previous January, RMI sees signs of year over year growth by March of this year.
Most lenders would be concerned about a January that lagged behind a holiday shortened December, especially when it also trails the previous year. Raising additional concern is the number of lenders participating in January increasing by 18.9% over December.
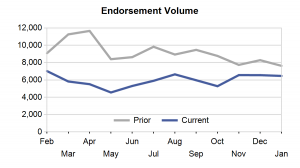
However, RMI points to two components that fuel their optimism of annual growth in volume. First, is tracking the monthly volume over the previous 12 months and comparing it to the previous year. In this chart, the current year, although running flat the past few months is converging with the prior year.

Assuming the current trend continues, RMI believes that current volume should cross over to year over year growth within the next two months. The good news in this theory is that RMI does not expect the same downward trend that occurred in early 2010, when endorsement levels reached lows.
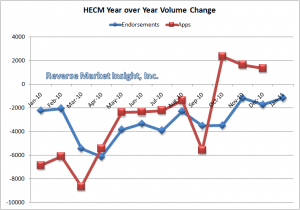
The other sign that RMI sees as a positive indicator is related to monthly applications. According to the chart below, applications are currently ahead of the prior year pace and have been since October. Since application trends trail endorsements by about four months, RMI expects this trend to be revealed beginning with February's production.

An interesting question that helps define the likelihood of this trend continuing to develop would be to examine pull through ratios. It is obvious that the application to closing pull through ratio has come down significantly from 2006, but has this started to level out? One might argue that with the reduction in the number of participating lenders, the quality of originations would conversely increase. However, the opposite could also be true as more originators are willing to take chances on challenging loans to boost production. A more thorough analysis of the pull through ratio could also help provide an accurate prediction of forward endorsement volumes.
In the top ten, six saw increases in volume when compared to January of 2010. This included increases by the top four lenders accounting for a 51.3% market share. Wells Fargo, continuing lead the way, say an increase of 40% at 1,687 endorsements in January. They were followed by Bank of America (843 loans, 17% increase), MetLife Bank (466, 66%) and One Reverse Mortgage (322, 59%).
Reaching the top 50 in retail production required 13 or more endorsements for the month.


