Inventory
info icon
Single family homes on the market. Updated weekly.Powered by Altos Research
722,032+456
30-yr Fixed Rate30-yr Fixed
info icon
30-Yr. Fixed Conforming. Updated hourly during market hours.
7.00%0.01
Reverse

HMBS: A History of HMBS Issuance

Written by Joe Kelly, as originally published in The Reverse Review.

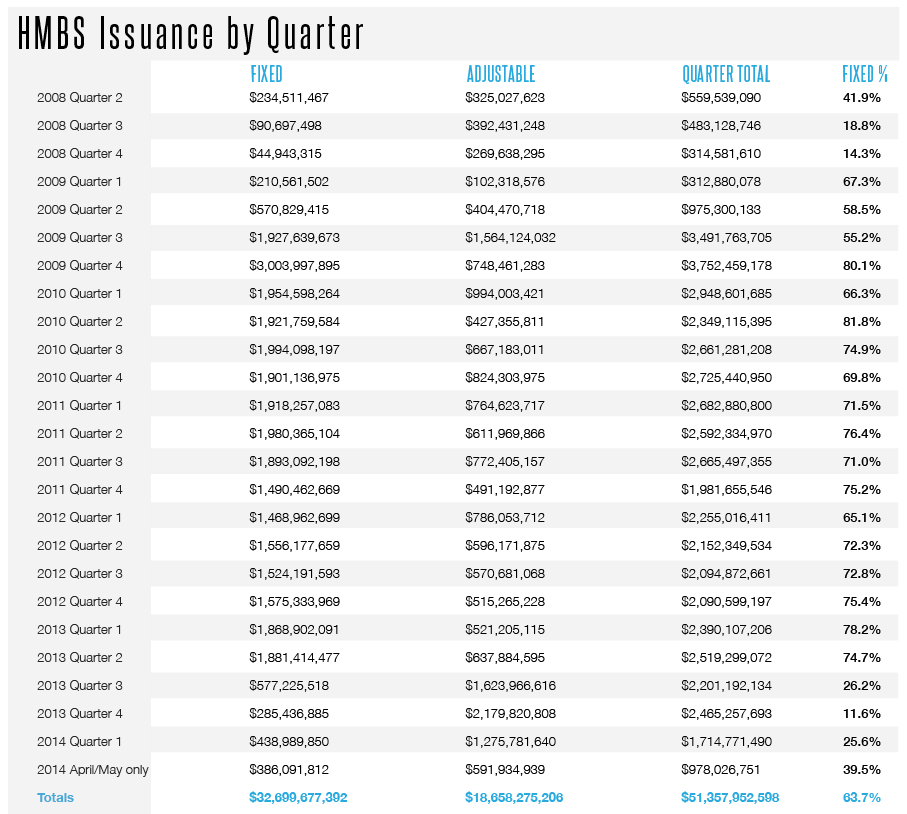
The history of HMBS issuance reveals a lot about the recent history of the reverse mortgage industry. In 2008 and 2009, it shows the tentative, low-volume beginnings of Ginnie Mae’s HMBS program, and the impact of Fannie Mae’s fade from the HECM whole loan market.

The golden era of HMBS was from 2010 through the first half of 2013, with high fixed-rate volume, steadily rising HMBS prices and big bank issuers. Since the second half of 2013, the numbers reveal the dramatically lower volume and shift away from fixed-rate HECMs as big bank issuers withdrew from origination and FHA lowered PLFs and imposed other restrictions.

Here’s a look at how HMBS issuance has fluctuated in the past five and a half years:

HMBS chart

Most Popular Articles

Latest Articles

An open letter to President-Elect Trump: A housing market in crisis 

As the rest of the country waits, debates, and predicts an economic recession, the United States housing market has been languishing in a historic one for nearly 3 years. Economists and market participants love airplane analogies (soft landing, no landing) so I’ll dust off my epaulets and declare the state of housing a “crash landing.” 

3d rendering of a row of luxury townhouses along a street

Log In

Forgot Password?

Don't have an account? Please