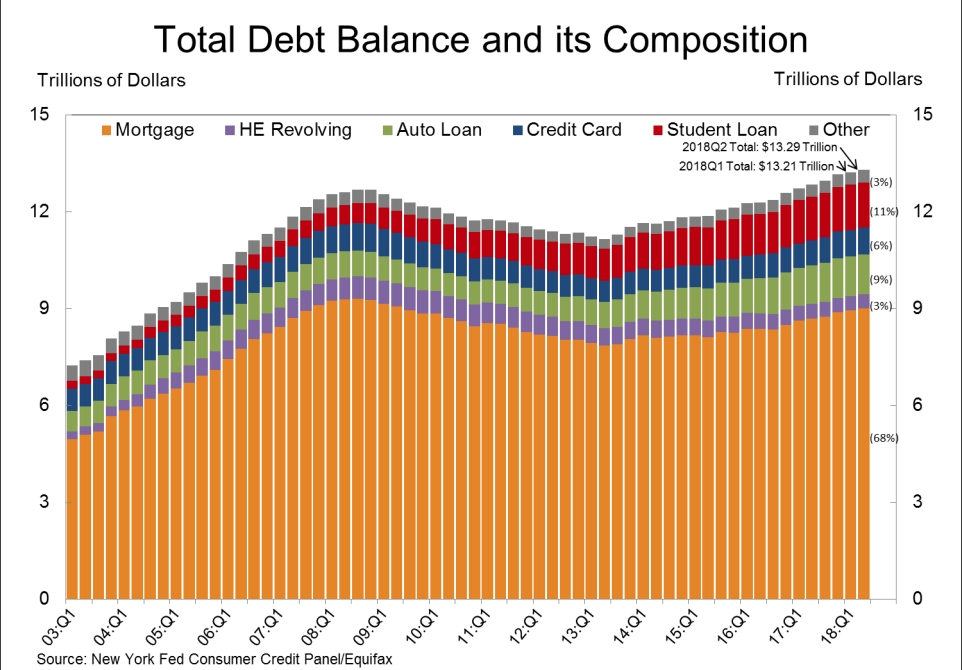
Thanks to increases in mortgage debt, auto loan debt, and credit card debt, Americans now have more debt than they ever have before.
The data comes courtesy of the Federal Reserve Bank of New York’s Center for Microeconomic Data, which just released its latest Quarterly Report on Household Debt and Credit.
The latest report, which covers the second quarter of 2018, shows that total household debt in the U.S. increased by $82 billion in the second quarter, meaning Americans now collectively carry $13.29 trillion in debt.
According to the Fed report, the second quarter was the 16th consecutive quarter that saw an increase in overall household debt (as seen in the chart below). Overall debt is also now $618 billion higher than the previous peak of $12.68 trillion, which happened in the third quarter of 2008.
(Click to enlarge. Image courtesy of the New York Fed.)
Much of the overall 2nd quarter increase of $82 billion came from mortgages. According to the report, mortgage debt rose $60 billion in the second quarter from the first quarter and now rests at $9 trillion.
Mortgage debt is also now $308 billion higher than it was during the second quarter of last year.
It’s the first time that mortgage debt has reached the $9 trillion threshold since the second quarter of 2009.
According to the report, there was $437 billion in new mortgage originations, which the Fed measures as appearances of new mortgage balances on consumer credit reports and includes refinanced mortgages, during the second quarter.
The Fed report states that the second quarter a “small” increase in mortgage originations, when there were $428 billion in originations, and notes that mortgage originations have been “relatively stable” over the last six quarters.
According to the report, the median credit score of newly originating borrowers was roughly unchanged for mortgages at 760.
On the servicing side of things, there’s been some improvement as well.
According to the report, mortgage delinquencies continued to improve, with 1.1% of mortgage balances checking at 90 or more days delinquent.
The report also showed that delinquency transition rates for current mortgage balances were stable, with roughly 1% of current balances moving into delinquency status.
The report showed that there was some improvement in transitions from early delinquency, as 13.4% of mortgages in early delinquency (those that are 30-60 days late) transitioned to 90+ days delinquent, an improvement on the previous quarter’s 14.7% transition rate.
Additionally, the report showed that the share of mortgages in early delinquency that were “cured” and moved back to current status improved to 42.9%, rising from 40.5% in the 1st quarter and from 35.9% in the 4th quarter of 2017.
Overall, approximately 76,000 individuals had a new foreclosure notation added to their credit reports between April 1 and June 30, unchanged from the previous quarter. “Foreclosures remain very low by historical standards,” the report stated.
Conversely, balances on home equity lines of credit continued a decline that began in 2009. HELOC balances saw a $4 billion drop in the second quarter and are now at $432 billion, which is $20 billion lower than the same time last year.
In the other forms of debt included in the report (student loan, auto loan, and credit cards), student loan debt decreased slightly in the quarter, falling $2 billion from the first quarter, while auto loans and credit cards were both up.
And while student loan debt declined a bit, it was still up $61 billion over the same time period last year and sits at $1.41 trillion.
Auto loan debt rose $9 billion in the second quarter and now rests at $1.24 trillion. Credit card debt rose $14 billion in the second quarter and now sits at $829 billion.
“Aggregate household debt grew for the 16th consecutive quarter in the second quarter of 2018,” said Wilbert van der Klaauw, senior vice president at the New York Fed. “While overall delinquency rates have remained stable at relatively low levels, transition rates into delinquency have fallen noticeably for student debt over the past year, reflecting an improved labor market and increased participation in various income-driven repayment plans.”


