Home prices have appreciated consistently since the housing market began its recovery, but now they appear to be slowing down after a six-year run.
The latest data from Black Knight reveals that home price growth has slowed in 33 states and in 71 of the nation’s 100 largest markets.
Annual gains decelerated by 1.3% from February to October, according to Black Knight’s latest Mortgage Monitor report.
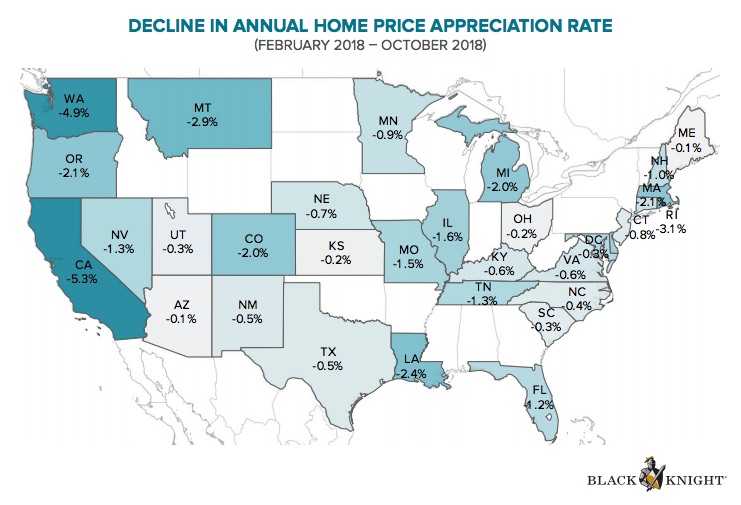
October saw growth flatten to just 5.4%, down from February’s four-year high of 6.7%. (See map below for nationwide declines in home price appreciation; click to enlarge.)
 The report notes that home price appreciation from July through October was the most tepid four-month stretch in nearly four years.
And, while the slowdown is apparent across much of the nation, the west saw the most deceleration, with California the standout as price growth fell below the national average for the first time since early 2012.
In February, home prices in California were up 10%, but fell to less than 5% by October, a trend Black Knight said is likely driven by lack of affordability.
Washington saw similar declines, falling from February’s 12.4% to 7.5% in October.
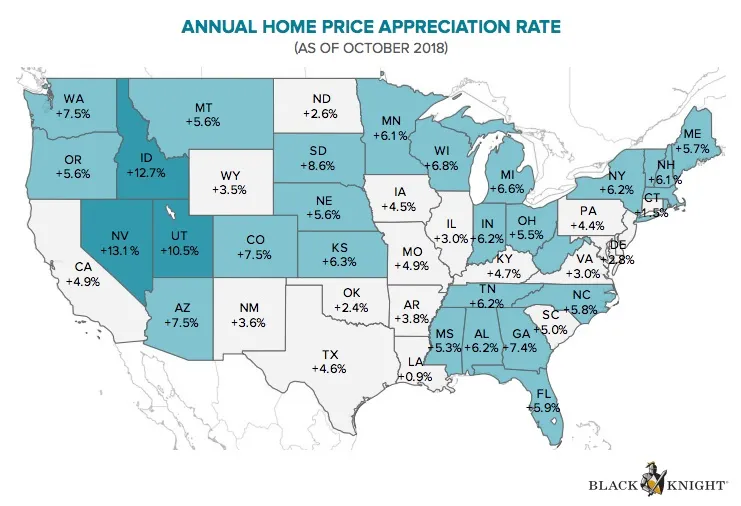
Now, Nevada, Idaho and Utah have the highest appreciation rates in the nation, with home prices in all three states up at least 10% from last year, while the majority of states have seen growth in the 5-8% range over the last year. (See map below for annual home price appreciation nationwide; click to enlarge.)


