


Although Americans have complained about high housing costs for decades, their concerns have taken on a fevered pitch recently. At first glance, these concerns seem reasonable: home prices have increased by more than 50% since the end of 2019. This is an annual growth rate of almost 14%—far higher than the long run average rate of 4%. We’ve recently lived through an unusually rapid run-up in home prices.
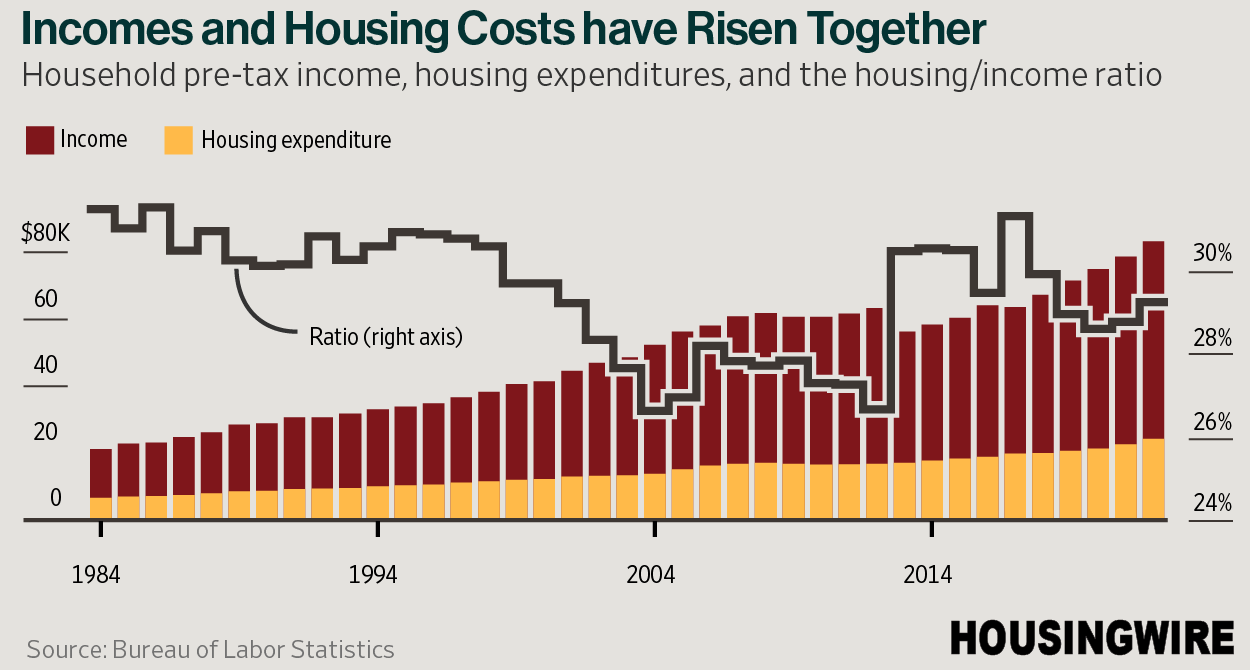
Yet, when we look at housing cost as a proportion of after-tax income, most households aren’t spending anywhere near 50% more. In fact, large contingents of the population are spending the same proportion, or less, of their income on housing than in the past.
How can we square these two facts: home prices are far higher, but most households are spending the same or less of their income on housing? There are three explanations.
Incomes have increased
Affordability is about both prices and incomes—and the latter have also increased dramatically over the past few years. According to the Bureau of Economic Analysis (BEA), over the last five years, the average personal after tax income has risen from about $16,000 to almost $21,000 today—a 30% increase (if these figures seem low, it’s because this is a personal, not a household measure, and it’s after tax). We haven’t had this kind of personal income growth over a five-year period in 20 years.
In fact, the rise in incomes is not just a buffer against higher home prices, it’s a cause. It’s unlikely we would have had this kind of sharp increase in prices without a concurrent increase in incomes. Incomes are the single best predictor of home prices.
Interest rate impact
Financing a home today is undeniably much more expensive than just a few years ago. The median home in 2019—priced at $212,000 and financed with a 30 year mortgage for 3.75%—would carry a monthly cost of under $900. That same home today costs $323,000, and financed at today’s rate of 6.75% would carry a monthly cost of almost $1,900. For the median home at the prevailing rate, housing costs have more than doubled.
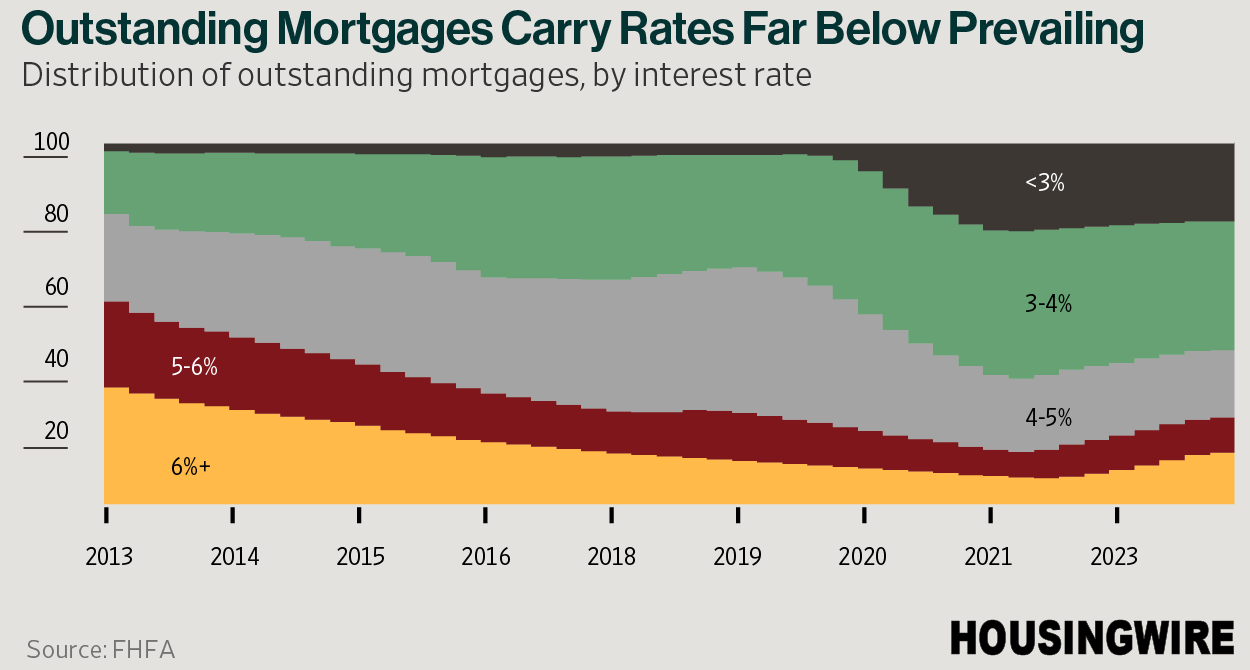
But one of the wonderful aspects of homeownership is being able to time your entry into the market, and to lock-in costs at that point in time. Moreover, homeowners have the option to ratchet their costs even lower by refinancing when the economy slows and mortgage rates fall. Millions of homeowners have seized exactly these opportunities over the past few years, buying and refinancing when rates were relatively low in 2020 and 2021.
As a result, even if the marginal cost of a mortgage is 6.75% today, the average homeowner is financed closer to 3.5%— even lower than the prevailing rate at the end of 2019. And that’s without accounting for those who channeled pandemic stimulus into paying down their mortgage balances, or paying them off entirely (this doesn’t impact net worth, but does reduce the housing cost to income ratio).
Rents
While home prices are roughly 50% higher than in late 2019, rents haven’t kept pace. This may be the effect of a surge of pandemic-delayed multifamily buildings rolling off the construction pipeline into completions. Regardless of the driver, rents are only up just over 30% since before the pandemic—providing relief to those who were unable or unwilling to buy.
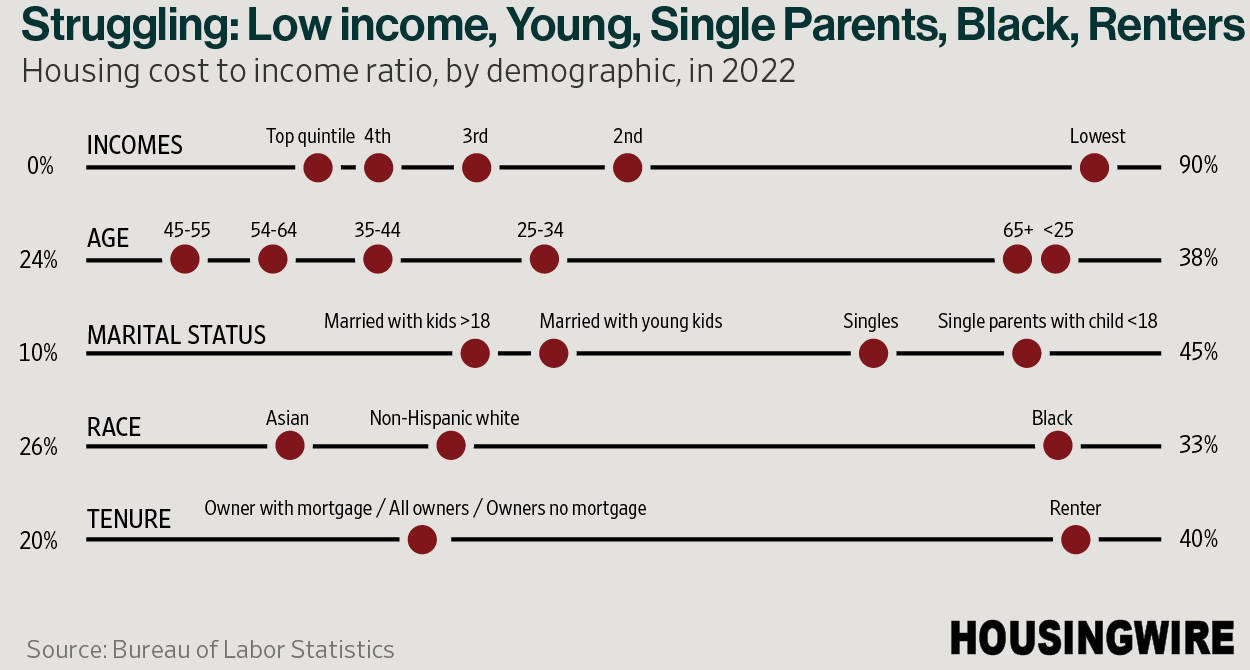
Of course, the aggregate statistics omit the fact that some demographic groups are struggling more than others. The chart below shows that the demographics spending higher than average proportions of their incomes on housing include low income households, the young (and the old, though retirees have lower incomes), single parents with young children, and Black people. Renters also spend more of their income on housing than owners.
Still—these are exceptions to the broader, long running, aggregate trend: a remarkable stability in housing costs as a proportion of income, over decades.
Aziz Sunderji writes the housing newsletter Home Economics. He was formerly a bond market strategist at Barclays Investment Bank and a Wall Street Journal reporter.

