


With little more than a week left in 2016, it’s already looking like the year will finish with lower reverse mortgage volume than in recent years. But even as industry volume trends lower on a national scale, some markets continue to show signs of growth at the city and zip code level.
Through October 2016 this year, Home Equity Conversion Mortgage (HECM) endorsements total 40,192 units, down 16.5% from the same period a year ago, when volume tallied 48,114 loans through October, according to a recent analysis of industry data by Reverse Market Insight.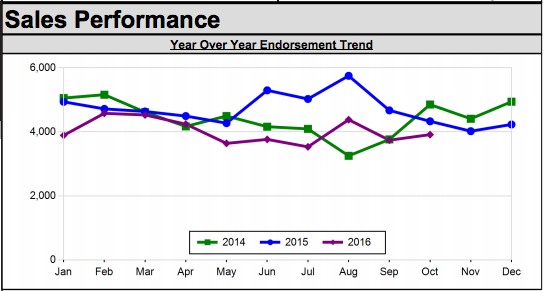
(Source: Reverse Market Insight)
On a monthly basis, volume was up 4.8% in October 2016—a month fueled by increases from the majority of U.S. regions nationwide and significant gains among the top-10 industry lenders.
Notable growth also occurred at the local level, with cities in Colorado, Texas, California and Arizona bucking the broader industry trend by producing year-over-year growth through October.
Denver led the way among cities in terms of year-over-year growth, with 345 units through October, representing a 45% increase form the comparable period last year.
Houston ranked third among cities for unit count with 345 loans through October, an increase of 4.3% from last year; while fellow Texas metro Austin ranked ninth overall with 185 loans, an increase of 16.4% from last year’s 10-month total.
With a 78633 zip code, Georgetown, Texas, also reported notable growth with 44 loans through October 2016, representing an increase of 12.8% from the city’s production last year.
Meanwhile, the Arizona cities of Sun City West (85375) and Surprise (85374) ranked among the top-10 zip codes for unit count with 54 and 45 loans, respectively, signifying year-over-year volume growth of 12.5% and 95.7%.
While much of the top cities for volume growth were located in the western or southern U.S., Toms River, N.J., was the first zip code from the state in quite some time to crack into the top-10, according to RMI’s analysis. Through October, Toms River recorded 44 loans, an increase of 37.5% year-over-year.
See where other states, cities and zip codes rank by volume here.
Written by Jason Oliva

