Homeowner equity growth continued to climb in the second quarter of 2019, according to the Q2 2019 home equity analysis from CoreLogic, a property information, analytics and data-enabled solutions provider.
Homeowners with a mortgage – about 63% of all homeowners – saw equity increase by 4.8%, a total of nearly $428 billion, since the second quarter last year. The average homeowner gained about $4,900 in equity over the last quarter.
“Borrower equity rose to an all-time high in the first half of 2019 and has more than doubled since the housing recovery started,” said Frank Nothaft, CoreLogic’s chief economist. “Combined with low mortgage rates, this rise in home equity supports spending on home improvements and may help improve balance sheets of households who could take out home equity loans to consolidate their debt.”
The total number of mortgaged residential properties with negative equity decreased 7% from the first quarter to 2 million homes, or 3.8% of all mortgaged properties. This is a drop of 4.3% from 2.2 million homes in the second quarter of last year.
“Home equity balances continue to grow across the nation,” said Frank Martell, CoreLogic president and CEO. “In the far Western states, equity gains are fueled by a long run in home price escalation. With strong economic growth and higher purchase demand, we expect these trends to continue for the foreseeable future.”
The value of negative equity in the U.S. at the end of the second quarter totaled approximately $302.7 billion. This is down $2.6 billion from $30.3 billion in the first quarter.
According to CoreLogic, negative equity has seen a recent decrease across the country.
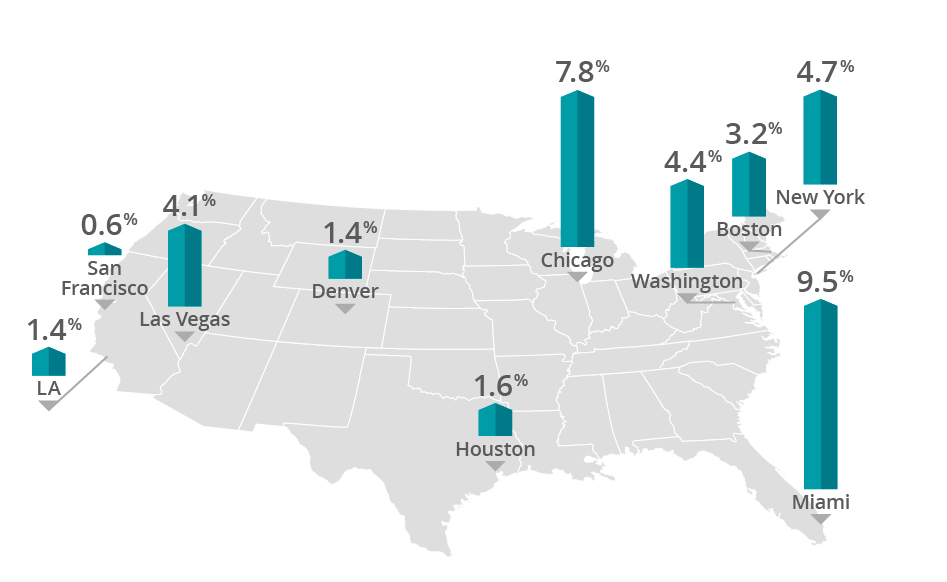
Of all the nation’s housing markets, San Francisco-Redwood City-South San Francisco, is the least challenged. In this market the Negative Equity Share of all mortgages sits at 0.6%.
On the opposite end of the spectrum, Chicago, which boasts the largest Negative Equity Share of the nation’s top ten largest markets, experienced a 7.8% increase in Q2.
“Home values have continued to rise in most parts of the country this year and we are seeing the benefit in higher home equity levels. The western half of the U.S. has experienced particularly strong gains in home equity recently,” Martell said. “In July 2019, South Dakota and Connecticut were the only two states to post annual home price declines. These losses mirror the states’ home equity performances during the second quarter as both reported negative home equity gains per borrower.”
This chart shows the negative equity growth of the nation’s largest housing markets:


