
[Editor’s note: As of November 2022, we no longer use Slack, and we’re happy to share that we’ve moved to Circle for our new community platform. We will be continuing Q&As, live discussions and more in this new community platform. If you’re a member and not a part of our Circle community yet, you can click the link at the end of the article to join.]
The housing market continues to be hot in most of the country, but there are signs that the party may be coming to an end. To help better understand what the latest data means for the industry, HousingWire Lead Analyst Logan Mohtashami answered questions about what it all means. The Q&A was hosted in the HW+ Slack channel, which is exclusively available to members. To join the next Q&A, you can join HW+ here.
Looking at the last few weeks, Mohtashami has covered a range of topics. From putting context around housing starts to explaining how housing data will moderate, it’s safe to say that there was a lot to cover.
The following Q&A has been lightly edited for length and clarity.
HousingWire: To begin, you mentioned how the home-price growth is not going great. Could you elaborate on why that is? How would that affect your predictions for 2022?
Logan Mohtashami: Of course! My biggest concern in 2021 was that home prices would take off in an unhealthy way, even after what happened in 2020. Since I didn’t believe in the Forbearance Crash Bro premise, this was the number one concern.
My home price model for the years 2020-2024, which is a big part of all my economic work, was that as long as we got only 23% peak growth in these five years, we will be fine. However, we have already pushed above that in 2 years. This is still my most significant concern for 2022 because total inventory levels haven’t reached my 1.52 million level, which I believe will take away the bidding wars and bring a B&B market — Boring and Balanced.
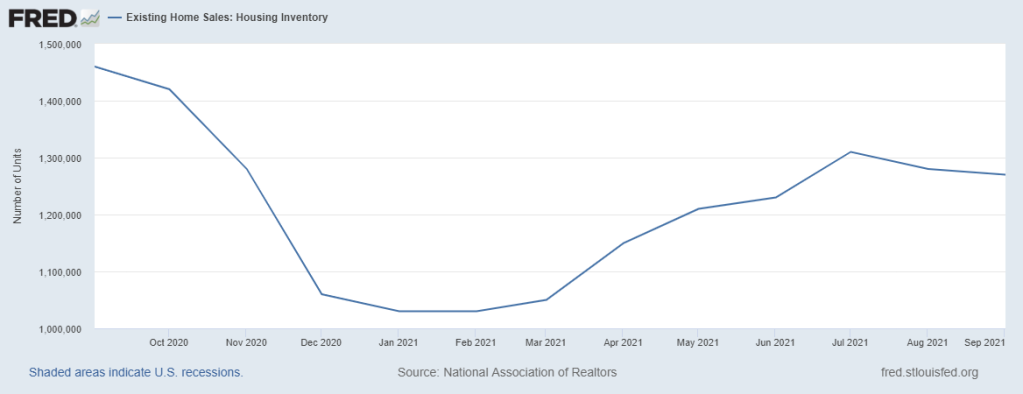
Seasonality has kicked in on inventory, so I hope that the volume decline isn’t as alarming as usual to give us a higher base to work from in 2022.
With this much price growth in 2 years, when or if rates rise, my target level since the summer of 2020 was 3.75% or higher, this will impact demand more — the longer and longer this goes. Since I have focused so much of my work for 2020-2024, my concern is that inventory levels are too low, and so are mortgage rates. I don’t believe mortgage rates can get to 3.75% and higher, because the 10-year yield can’t crack over 1.94%. This was my level forecast for 2021.
Now people can see why even back on April 7, 2020, I wrote that when the economy is recovered, the 10-year yield should be in a channel between 1.33%-1.60%, which was always a 2021 story, and like clockwork, it did what it should have done.
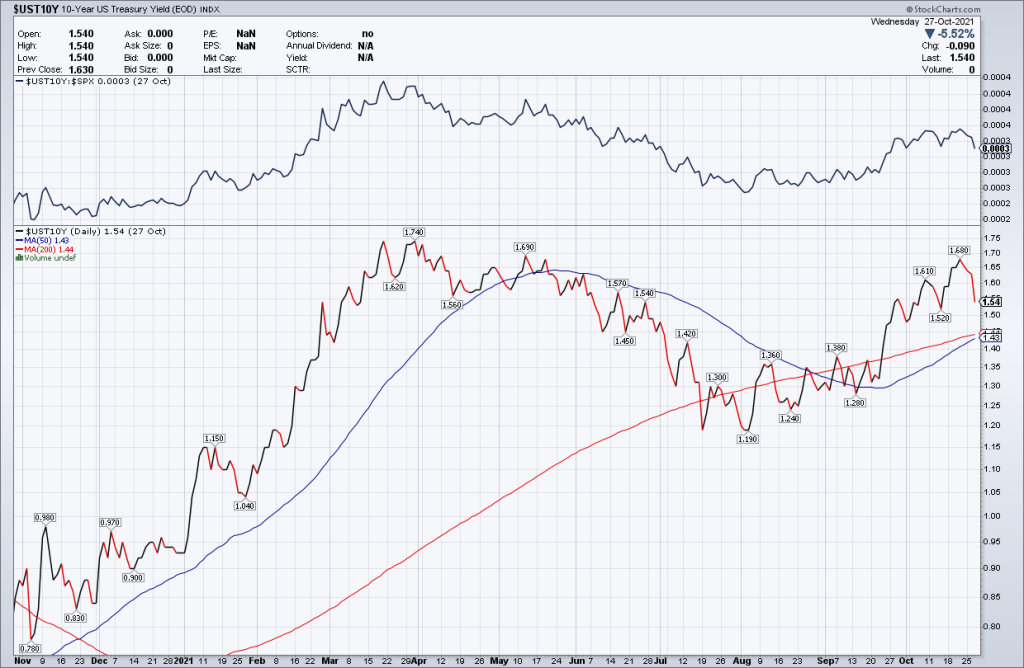
HW+ Member: Logan, now that the economy seems to have stabilized post-Delta, and we’re seeing inflationary pressures, do you see the 10-year moving higher over the rest of this year and into 2022?
Logan Mohtashami: I have always waited until the end of the year to give my forecast. I believe I will be one of the few people in America that will say rates will go lower in 2022, depending on where the bond market is in December.
I have always put more faith in the four-decade-long downtrend on the 10-year yield than what the economy has done. I say this being the most bullish economic person in 2021, but I still can’t forecast a 10-year yield over 1.94%, regardless of the inflation data. I can discuss how the 10-year yield could get as high as 2.42%, but many variables outside the U.S. have to go into that, which I will address at the end of the year. However, don’t be shocked if we see 2.5% – 2.62% rates next year.
HousingWire: You’ve been featured in a lot of podcasts and debates lately, has there been a theme in their questions and what do you wish these people would take away from your discussions?
Logan Mohtashami: I am so happy that HousingWire published my America Is Back Recovery Model on April 7, 2020. Not everyone would have done that during the peak madness of Covid-19. For myself, Housing in 2020-2024 has always been the main economic talking point, since separating my work from the 2008-2019 period, which I often expressed would be the weakest housing recovery ever.
After 2020/2021, and holding firm to my economic models, it does show that boring, nerdy people can win in a society that awards trolling the United States Of America with doomsday themes. Now everyone wants to know what is next.
However, it’s always good to understand why something happened more than the final result. For those who might not know about the America Is Back Recovery Model, this Wall Street Podcast gives you an idea of how we got there and why Wall Street has been paying attention.
HousingWire: We touched a little bit on this, but at the start of the month, you wrote an article on mortgage rates getting over 4%. In that piece, you talk about how you were asked in a podcast interview why you always talk about 1.94% as a key level since 2019. Can you expand on that here? And, can you touch on that question — when will rates go over 4%?
Logan Mohtashami: I am, by nature, a bond market person first, rather than a mortgage rate person. Back in 2019, when the inverted yield curve, I stressed back then not to believe in the higher rate of growth until the 10-year yield can close above 1.94% and get more bond selling after that. In 2019 it closed at 1.94% and didn’t go higher. I stressed that level in my 2020 forecast well before COVID-19 even was being discussed. So naturally, when COVID-19 was more apparent, I talked about recessionary yields being -0.21% – 0.62%. On April 7, 2020, I wrote the recovery model because we were above that level of 0.62%.
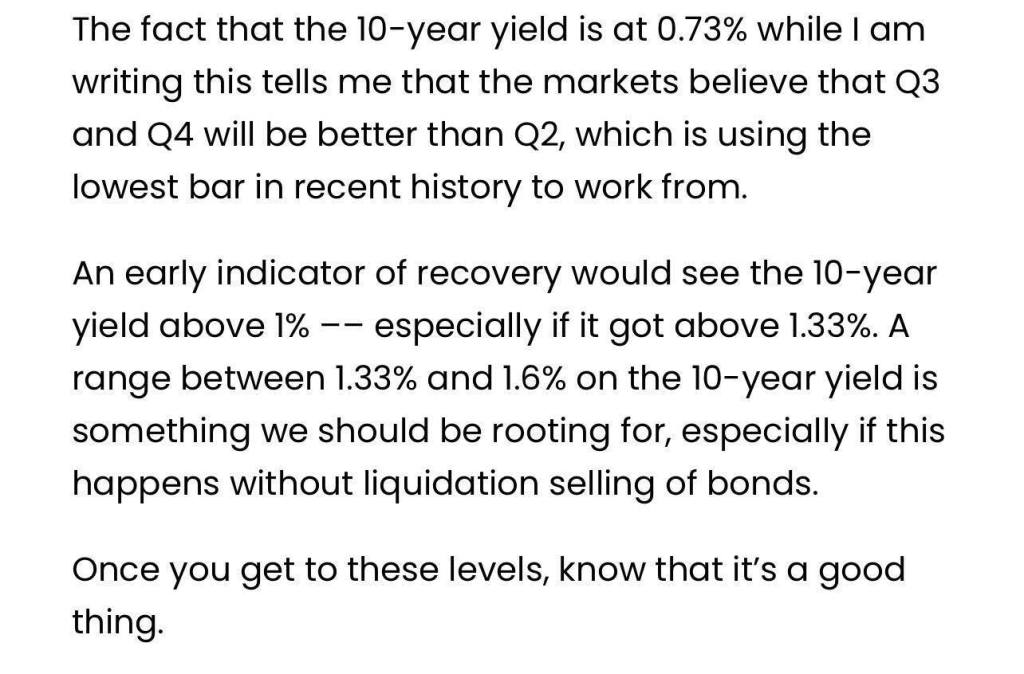
Now that we have recovered and into the expansion, respecting the four decades’ downtrend in yields, I can’t forecast over 1.94% in 2021 and will detail what to expect in my 2022 Forecast Article. Still, it’s all about the downtrend for me, more than anything else, and this story started in 2019 with that 1.94% level.

This photo was me at the 2018 Economic Conference in Orange County when 50 economists polled by the Wall Street Journal and the economist at this event all had higher rates, and I had to go up and show why that downtrend is more important.
HW+ Member: So, over the last week or so, a lot of housing reports have come out. You covered the latest new home sales, existing homes sales and new home supply reports. From your perspective, what did these reports show or what do people need to know?
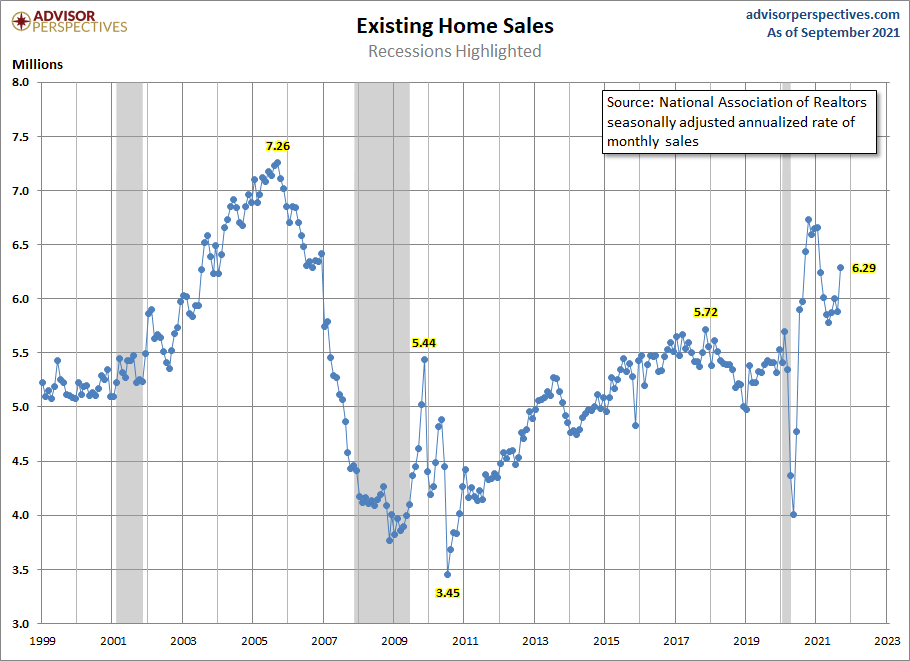
Logan Mohtashami: First, existing home sales came in as a beat for me based on my sales range forecast for 2021. Purchase application data has firmed up the past eight weeks, and not many people have noticed this.
“The rule of thumb I am using for 2021 is that existing home sales, if they’re doing good, should be trending between 5,840,000-6,200,000. This, to me, would be considered a good year for housing.”
So anything over 6.2 million after we had the moderation is a clear beat in my eye.
I know a lot of Youtube Crash Callers had talked about a Q4 crash in housing this 2021. Remember, these people are not data analysts; they’re professional grifters, so you have to take their trolling with a grain of salt.
New home sales data is more interesting because we saw a spike in monthly supply earlier in the year. My rule of thumb always is this with the new home sales market.
- When supply is 4.3 months and below, this is an excellent market for the builders.
- When supply is 4.4 to 6.4 months, this is an ok market for the builders. They will build as long as new home sales are growing.
- When supply is 6.5 months and above, the builders will pull back on construction.
What has happened over the past few months is that the monthly supply data has stabilized; this explains why the builder’s confidence grew recently.
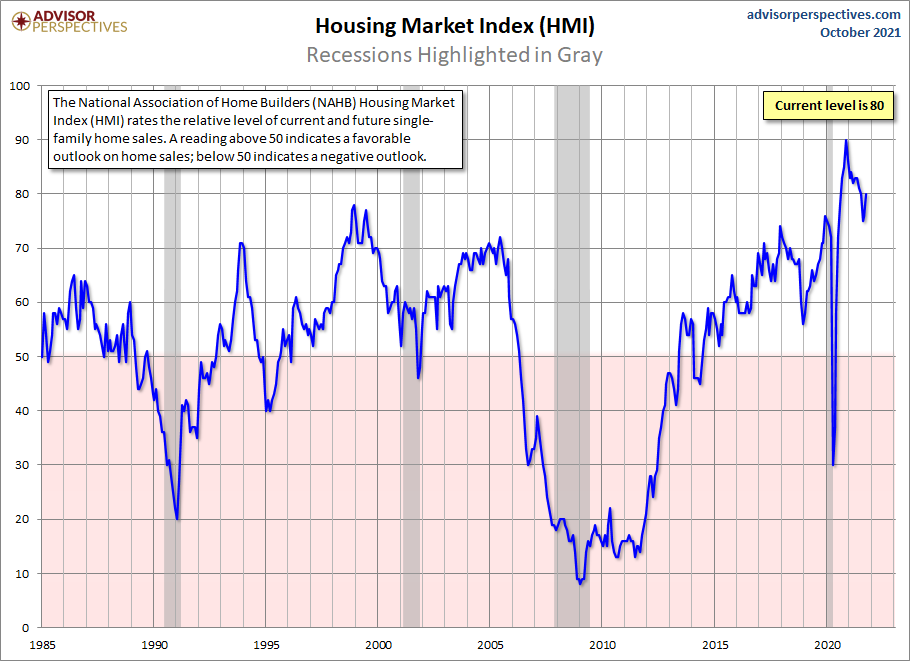
I would label this market as just an Okay Market place as the three-month average monthly supply is at 6.1 months roughly. So, it’s encouraging to see that the monthly supply didn’t break over 6.5 months.
When the monthly supply is below 6.5 months, and new home sales are growing, this means housing starts have legs to walk higher.
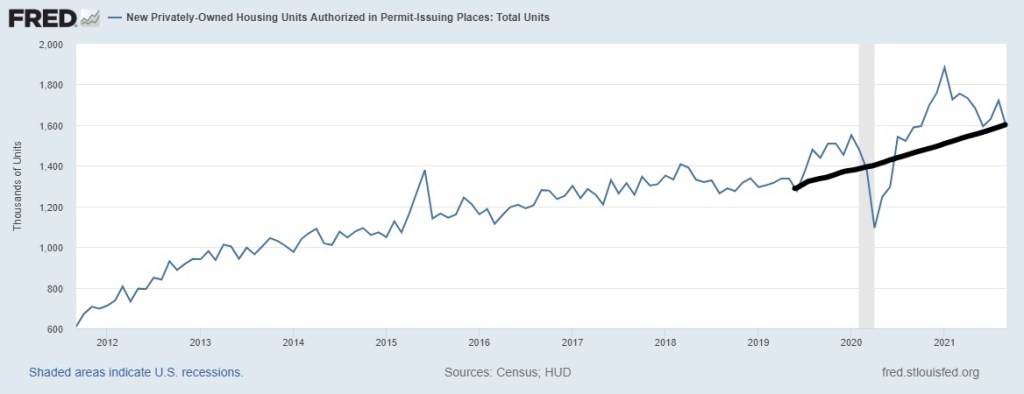
What has happened finally this year is that we will officially start a year over 1,500,000 housing starts. This has been a very long term call of mine over the past decade as I never believed we would begin to a year at 1,500,000 housing starts or higher until years 2020-2024, and we are finally getting there.
I know the industry has had many questions on Ivy Zelman’s premise that we are 20% overbuilt already. I addressed that topic right here by picking apart her words and what I believe they mean.
HousingWire: To wrap up, last time we were here, we asked for your predictions on how the Delta variant will affect the housing market. What impacts were made? What stayed the same?
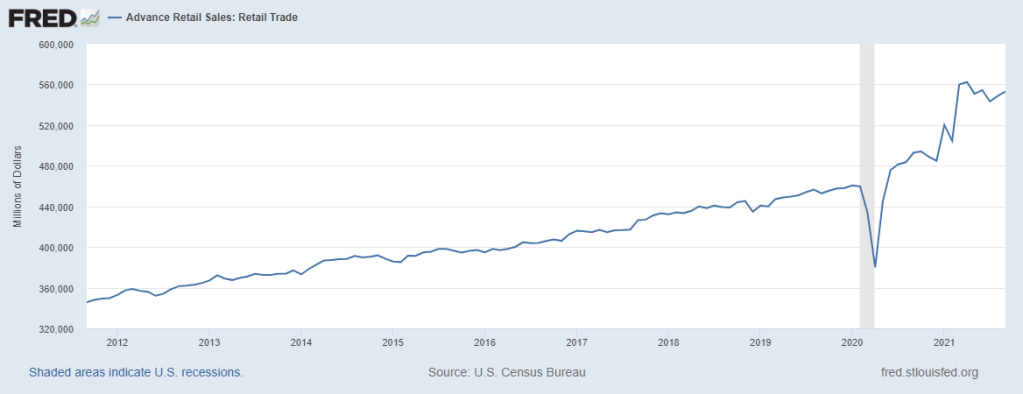
Logan Mohtashami: The Delta variant impacted travel and dining out, and COVID-19 has done some real damage to the Auto Industry, which doesn’t have enough cars to sell. Retail sales in America have been fire, the most significant deviation from the trend I have ever seen in my life.
Regarding housing, purchase application data stayed firm during the Delta and has picked up some traction recently. Remember, this data line looks out 30-90 days, but seasonality ended with this data line after May. So all in all, housing did well during Delta because people need somewhere to live more than cars, dining out or travel.
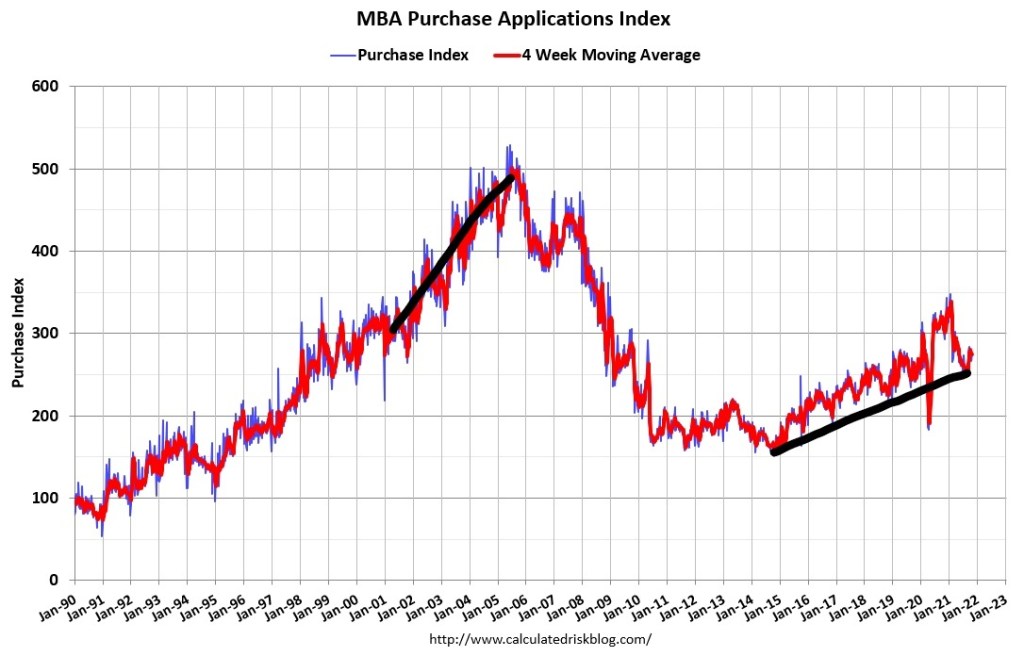
As you can see above, today’s housing market doesn’t remember the speculative demand we had from 2002-2005. It’s two different marketplaces.
Take full advantage of your HW+ membership and join our exclusive Circle platform dedicated only to HW+ Members! To join the community, go here.


