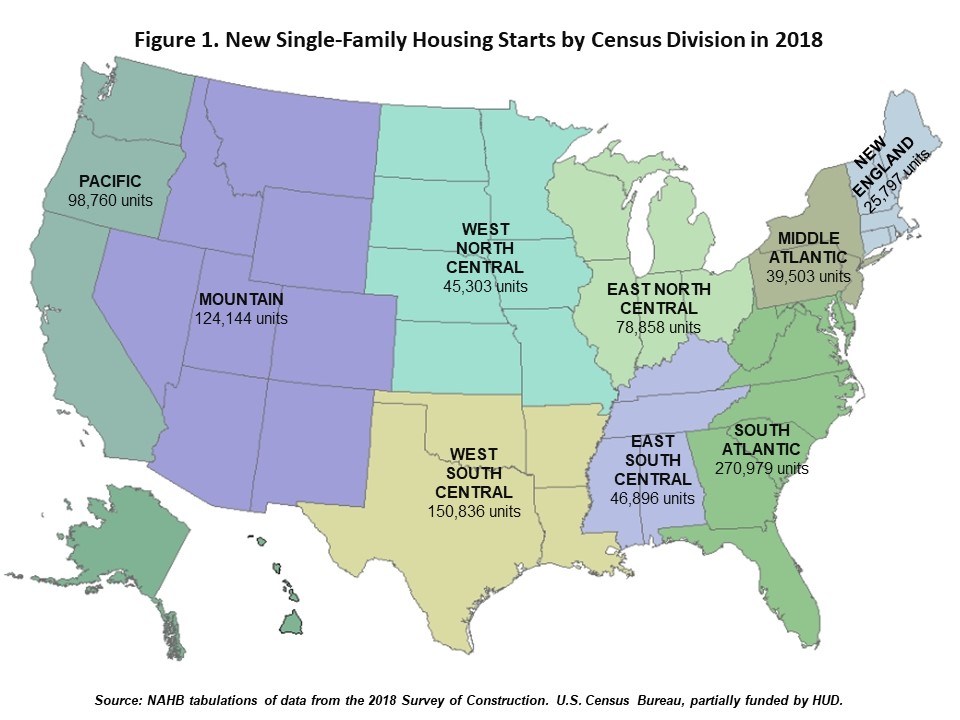
Analysis from the National Association of Home Builders shows that were 881,076 new single-family houses units started in 2018, a 4% increase over 2017.
The report shows that last year saw twice as many units started as they were in 2011, but last year was still 49% less than the peak of 2007, when there were 1,731,171 units started.
In 2018, in the Pacific Division, there were 98,760 new single-family units started, while in the East North Central Division, there were 78,858. The Pacific Division accounted for 11% of the total new single-family housing starts, and the East North Central Division accounted for 9%.
East South Central, West North Central, West North Central, Middle Atlantic and New England accounted for the remaining 18% of total new single-family housing starts.
Compared to 2017, the New England Division and the Mountain Division had a noticeable acceleration in growth in 2018.
Even though New England Division had the smallest amount of growth with 25,797 starts, the New England Division also grew by 13% in 2018, after a 5% growth rate in 2017.
(Image courtesy of the National Association of Home Builders. Click to enlarge.)
Six of the nine divisions saw a noticeable deceleration in growth in 2018, including the West North Central Division, which saw a 14% decline in 2018, the largest out of those divisions. Conversely, the West Central South Division saw an increase of 8% in 2018, the same amount of increase it saw in 2017.


