


Both existing housing inventory and home prices have been rising together year over year, which might seem odd at first glance since existing home sales are trending near all-time lows. However, I can clear up any confusion on this topic.
Let’s keep it simple: total active listings are still below 2019 levels nationally, and the days on market are under 30 days today. Existing home sales aren’t crashing as they did in 2022, when we saw home-price declines in the second half of 2022. When you connect the dots, this is a short and simple answer to why housing inventory and home prices are both rising.
From NAR: Existing-home sales slipped 0.7% in May to a seasonally adjusted annual rate of 4.11 million. Sales descended 2.8% from one year ago. The median existing-home sales price jumped 5.8% from May 2023 to $419,300 – the highest price ever recorded and the eleventh consecutive month of year-over-year price gains. The inventory of unsold existing homes grew 6.7% from the previous month to 1.28 million at the end of May, or the equivalent of 3.7 months’ supply at the current monthly sales pace.
Below are four charts showing the data from NAR mentioned above.
Existing home sales
When mortgage rates started to rise earlier this year, existing home sales trended lower. I believed this would be the case, so much so that I wrote that the February report would likely be the seasonal peak monthly print in home sales this year. Just as they did in 2023, higher rates took the winds out of the growing sales numbers. However, what is different this year from 2023 is that we have more sellers that will be buyers. As you can see in our new listing data, we are showing growth.
That means that our weekly pending sales contract data is showing growth year over year. It’s nothing spectacular but it’s growth nonetheless. However, if mortgage rates went lower and stayed lower, everyone would be selling more homes today.
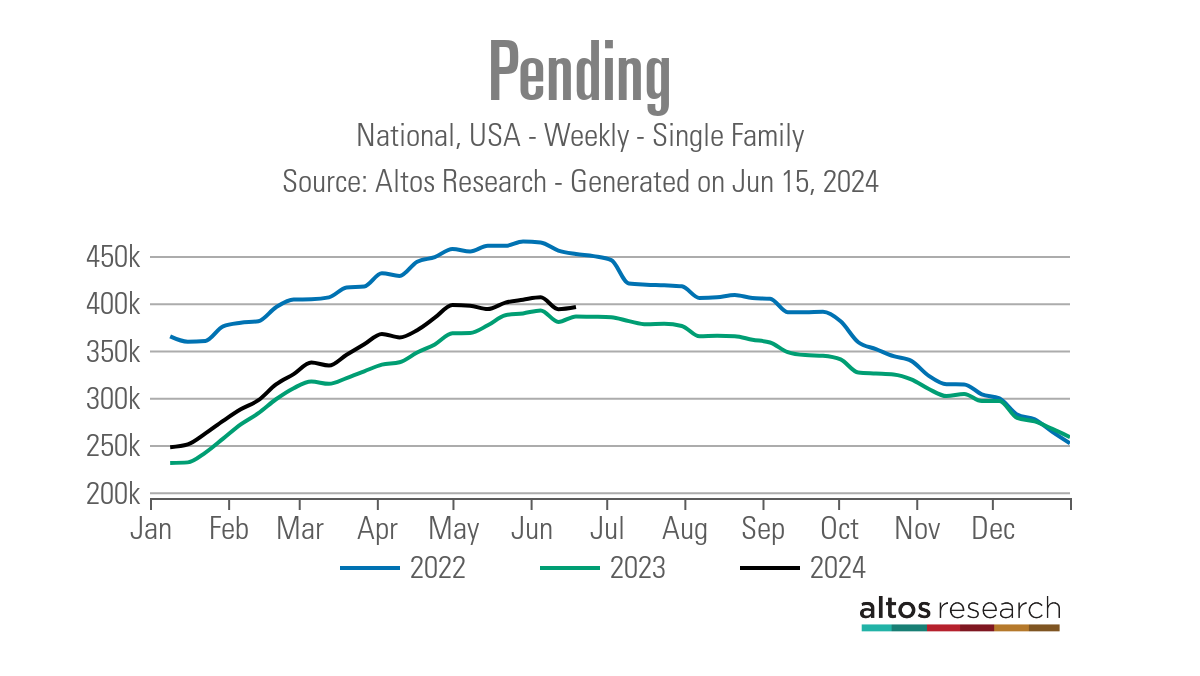
Home prices and inventory
Of course, if you follow our weekly tracker data, you know that inventory has been growing this year. The existing home sales print is catching up to our data, and this, to me, is the best story for housing in 2024 because when the housing market was savagely unhealthy in 2022, the NAR total active listings data was below 1 million.
Also, the days on market were in the teens, and nothing good is happening when the days on the market are a teenager or less because that means we either have massive credit sales or simply have too many people chasing too few homes. Of course, the housing market didn’t have the credit sales boom it had from 2002-2005, but it lacked inventory.
As you can see below with our weekly data, inventory is growing at a healthy clip this year. It’s a bit too slow for my taste, but good enough.
Since most of the country is still below 2019 inventory levels and home sales aren’t crashing anymore, national prices are rising. However, the year-over-year data will cool down going forward. We have been working from extremely low comps over the last two months, as the data last year showed median home prices declining year over year. So, the bar has been low but won’t be low for the rest of the year, and that will cool down year-over-year price data. Also, inventory and price-cut percentage data have gotten better after March.
All in all, there was nothing too surprising about today’s exciting home sales report. Mortgage rates have fallen recently and this last week was our first back-to-back week of purchase application data growth. We will see if that streak continues next week.
As I always stress, tracking the fresh weekly data lines on the weekend tracker, which considers a number of housing variables, means you won’t be surprised when the existing home sales report comes out. Look for that tracker article every Saturday so you stay up to speed on what is happening in real time.


I’m looking to understand how the pending data has been stronger YTD than prior year, yet our existing home sales actuals are lower. Does that mean that the fall-out rate of our pendings is greater than last year? It doesn’t appear that it’s based on the lagging nature of the NAR existing home sales data versus the more real-time nature of the HW pendings data, but maybe that’s the reason? I’m trying to understand if the HW pendings data is suggesting that we’ll sell more homes in ’24 than we did in ’23 or if ’24 will result in fewer existing home sales than ’23 as measured by what the NAR data is showing.
Hi Christopher
The NAR’s year-over-year data, per the last monthly report, was down 2.8%. Since sales trended lower in 2023, if the trend stays the same, some of the monthly reports will be positive, as sales trended lower toward the second half of 2023 when rates headed toward 8%.
For example, in MAY This was their forecast: 2024 existing-home sales will rise to 4.46 million (up 9% from 4.09 million in 2023)
The weekly contracts are homes going into contract, which can take 30-60 days before they hit the sales data. The YoY growth isn’t much, but the total sales should be slightly higher if it stays the same. The NAR had higher sales estimates early in the year but dialed that back.
We have a very low bar for sales growth in 2024. So far, every monthly print has been higher than the total sales level of 2023. If this trend continues, total existing home sales will be higher
For example, in MAY ( This was the NAR forecast in May)
This was their forecast: 2024 existing-home sales will rise to 4.46 million (up 9% from 4.09 million in 2023)
@Logan – thank you, your insight and analysis is much appreciated for those of us out here slugging it out!! I guess my question is this; if you just look at the HW pendings data it would suggest that we’re selling more homes in ’24 than we did in ’23. However, the NAR existing home sales actuals say that we’re selling less than we did in ’23. So what’s the actual story?
Christopher
(However, the NAR existing home sales actuals say we’re selling less than we did in ’23. So what’s the actual story?)
Last year, the mortgage headed toward 6%, and we got that one massive monthly home sales print, and then home sales slid lower the rest of the year. The weekly contracts are just signed contracts that don’t come into the existing home sales reports until later. So, the month-to-month data year-over-year can show declines and then growth while the pending contract data stays steady. So, as long as the weekly contract data remains consistent, showing a slight increase, and rates don’t go higher, we should end up with more than 4.09 million total existing home sales.
As I wrote back in March for the February existing home sales report, the monthly sales data most likely peaked at 4.38 million unless rates went lower, but if the trend contract data is positive, we can have slightly higher total home sales.
Sales started to suffer last year when the mortgage rate reached 8%. That low bar will give us some positive prints, but it doesn’t mean the slight growth in contract data year over year is growing faster. It’s just a very slow but steady positive YoY print. If mortgage demand grows more, sales can scale higher.
I talked about this on our podcast data with purchase application data because people are wondering why home sales haven’t fallen double digits toward the mid-3 million level. After all, purchase apps are down double digits year over year. That data line is just a trend survey data line