


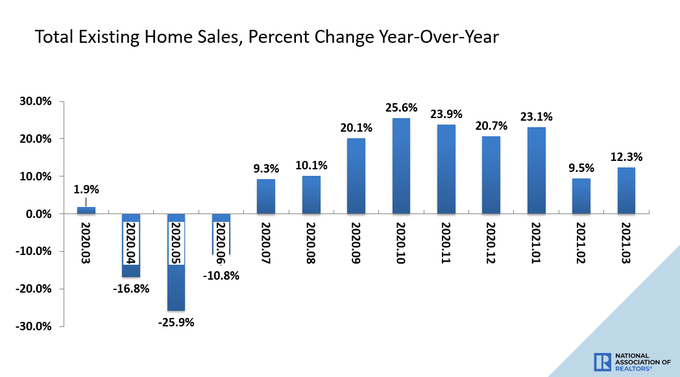
According to the National Association of Realtors, March’s existing-home sales came in at 6.01 million. Because March 2020 sales were slightly weaker due to the start of COVID-19, the year-over-year growth in sales for March 2021 came in at 12.3%. For the housing market, the COVID crisis started in earnest the week of March 23, as that is the last week we saw positive year-over-year data in 2020 before COVID-19 really took us for a ride.
So take this year-over-year demand data with a grain of salt. Next month will have a much bigger year-over-year growth sales print. Likewise, later in the year, we can expect to see some significant negative year-over-year prints, because 2021 is being compared to months of make-up demand.
From NAR:
My biggest fear for the U.S. housing market has been that home prices could escalate to an unhealthy level in the years 2020-2024. You may recall that I repeatedly warned that this could happen and this is now happening. We now have what I would consider to be the unhealthiest housing market in the last 10 years. According to the current NAR data, the median sales price jumped 17.2% year over year. Holy Hot Home Price Growth Batman!
This isn’t happening because of a credit boom. If we make corrections in the year-over-year data for COVID-19, then the purchase application data is positive, but not by too much. The last four weeks show year-over-year growth of 57%, 51%, 51%, and 39%, but those are with the COVID-19 low comps. Once we make some adjustments, we are barely up.
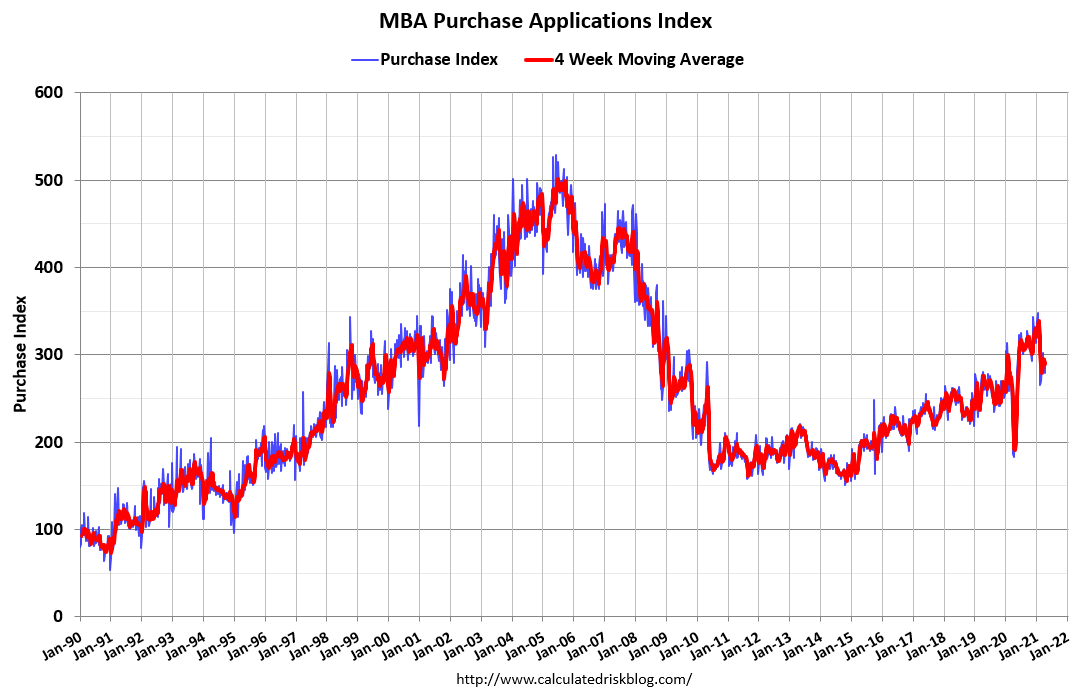
The hot pricing in this housing market has more to do with the inventory crunch than record-breaking demand. Demand is nowhere near what we saw from 2002-2005. Unless mortgage rates go higher, it’s hard to cool down this rate of growth in a meaningful way. Higher bond yields and mortgage rates have been a great stabilizer in the previous expansion to cool down the rate of growth in prices, they’re just not high enough now.
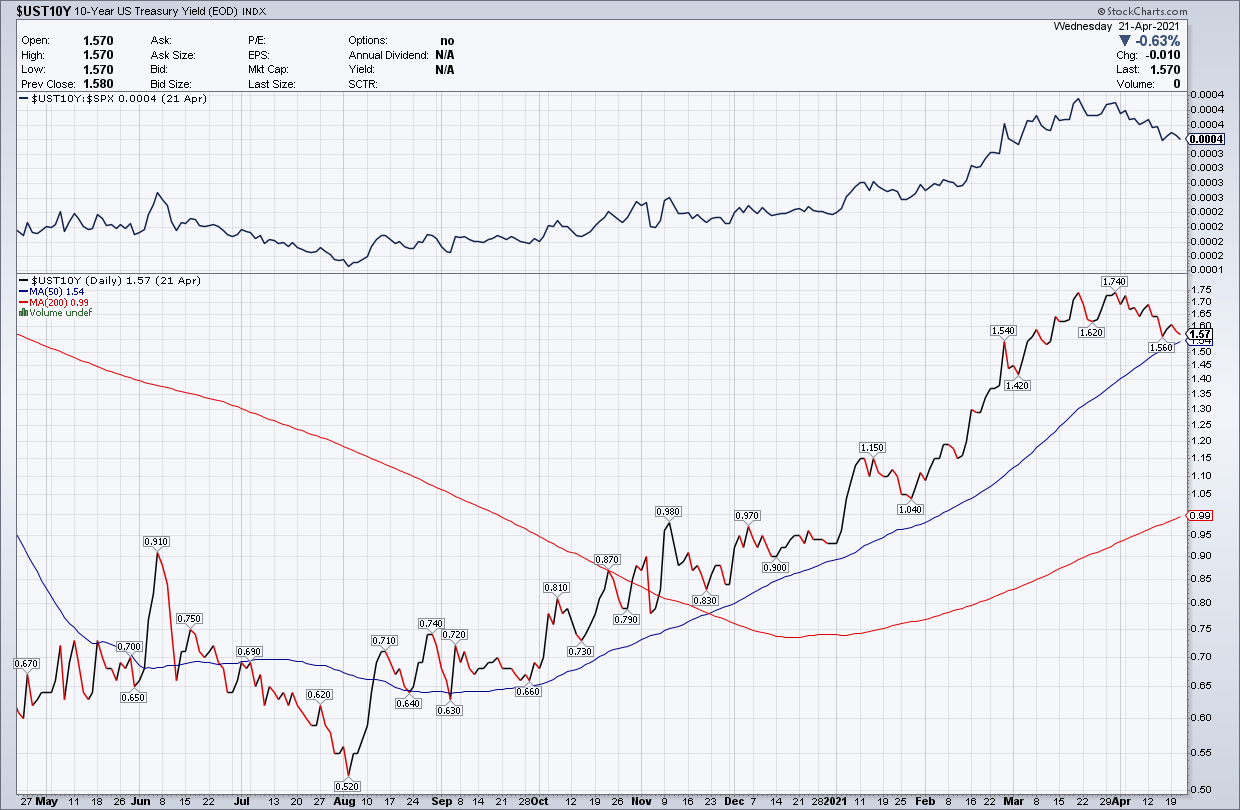
The bond market has gone up significantly since the lows in August. But because the world is still dealing with COVID-19, we haven’t had that second move higher in bond yields in 2021. The U.S. economy led the world out of the recession and our economic data warrants much higher bond yields and mortgage rates.
But other countries in the world are dealing with new surges in cases, and some are once again going into some form of a lockdown, which is suppressing bond yields from rising. So, we have this better economic data with low-level bond yields. We know from our history that only higher rates will moderate home-price growth and I do believe we are at the height of the inventory crunch.
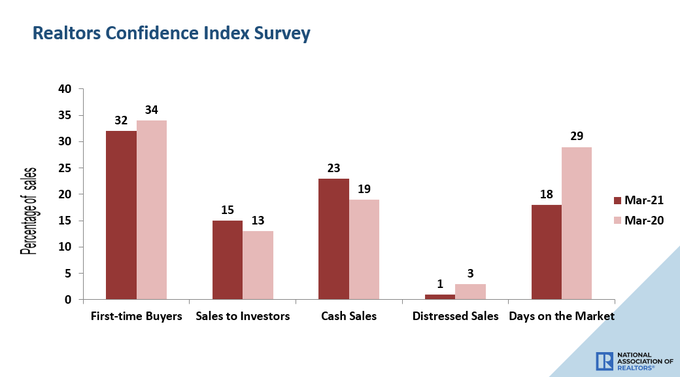
At some point in the future (hopefully), higher mortgage rates will cool home-price growth and extend days on the market. We are still at 18 days on the market, down from 29 days last year. But remember, housing market data from last year should be taken with a grain of salt because COVID-19 changed behavior significantly
As you can see below, sales to investors are up year over year. Cash buyers also grew compared to last year. But investors and cash buyers are not the main drivers of housing demand in America. Still, I will be interested to see if we have an uptick in cash and investor buyers over the next few years.
For many months I have been writing that existing home sales data should go back down to 6.2 million and lower. This current report is consistent with that thesis. Considering our current economic conditions, the U.S. existing home sales market should have a monthly sales print between 5,840,000 and 6,200,000. We have had some prints over 6.2 million and we should get some under 5,840,000 as well. We ended 2020 with 5,640,000 in total existing-home sales, so this sales range for 2021 represents a good year.
We will not have a housing credit sales boom, but will see steady, built-in demographic replacement demand. If any monthly sales print goes above 6.2 million, then the housing market will have done better than I expected. The sales range above provides appropriate guardrails for gauging the market going forward into 2021.
The most significant data point from today’s report, in my opinion, is home-price growth of 17.2% year over year. Purchase applications year over year, once corrected for COVID-19, aren’t showing much growth, so it is not demand that is stoking this high of price growth. It breaks my heart to see this because the years 2020-2024 are one of the most favorable periods for household formation in our economic history. This is because during this period we are enjoying the best demographics for home-buying.
A huge number of people are coming of the age when they just want to buy a home to live in and raise their families. These are not flippers or stock traders looking to make a quick buck or looking for rental income. These are just American families looking for a place to live to raise children and contribute to society.
The good news is, I believe we are coming to the end of the deficient inventory levels and rapid home-price growth. The one thing that can cool this housing market is higher rates and that has to happen eventually. Rates have moved up from the recent lows, but not enough to move the days on the market from 18 days back to 37-45 days as it has been in the past. This is the aftermath of COVID-19, the Chaos theory and the Butterfly effect. We have good economic data, but bond yields, here and around the world, are still low.
This is a first-world problem. Demand is at solid levels, but we don’t want the U.S. to end up like Canada, Australia, France, and the U.K when it comes to real home-price growth. Our real home-price growth has lagged those countries for some time but we shouldn’t be rooting to catch up with them. Unless we develop unhealthy speculative demand, the collapse of the U.S. housing market to get well below 4 million isn’t likely with such financially strong homeowners, good demographics and low mortgage rates.
By now you should all know how solid American homeowner balance sheets are despite the malarkey we continue to hear from the Forbearance Crash Bros.


